Open Access
Fig. 11.
Download original image
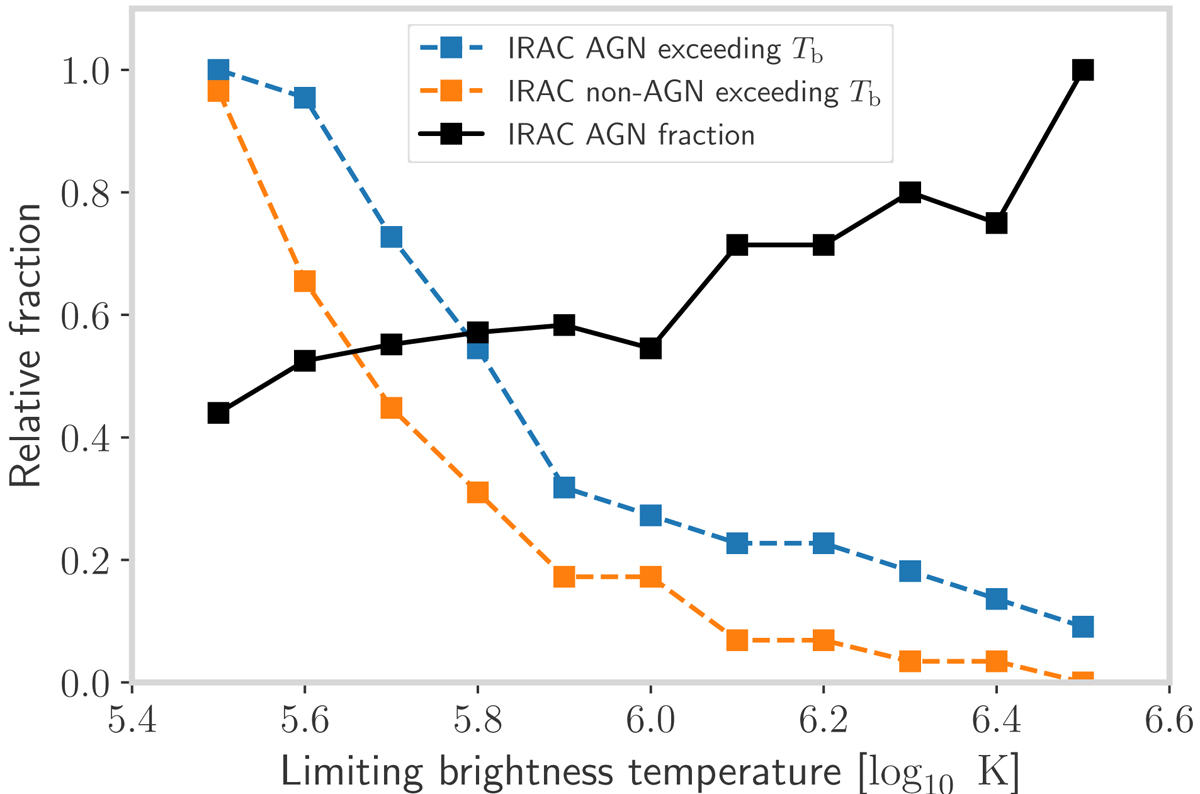
Fraction of IRAC sources as function of certain brightness temperature limit. The black solid line indicates the fraction of IRAC AGN in sources that exceed the limiting brightness temperature. The red and blue dashed lines indicate the fraction of IRAC AGN and IRAC non-AGN, respectively, that exceed this limit.
Current usage metrics show cumulative count of Article Views (full-text article views including HTML views, PDF and ePub downloads, according to the available data) and Abstracts Views on Vision4Press platform.
Data correspond to usage on the plateform after 2015. The current usage metrics is available 48-96 hours after online publication and is updated daily on week days.
Initial download of the metrics may take a while.