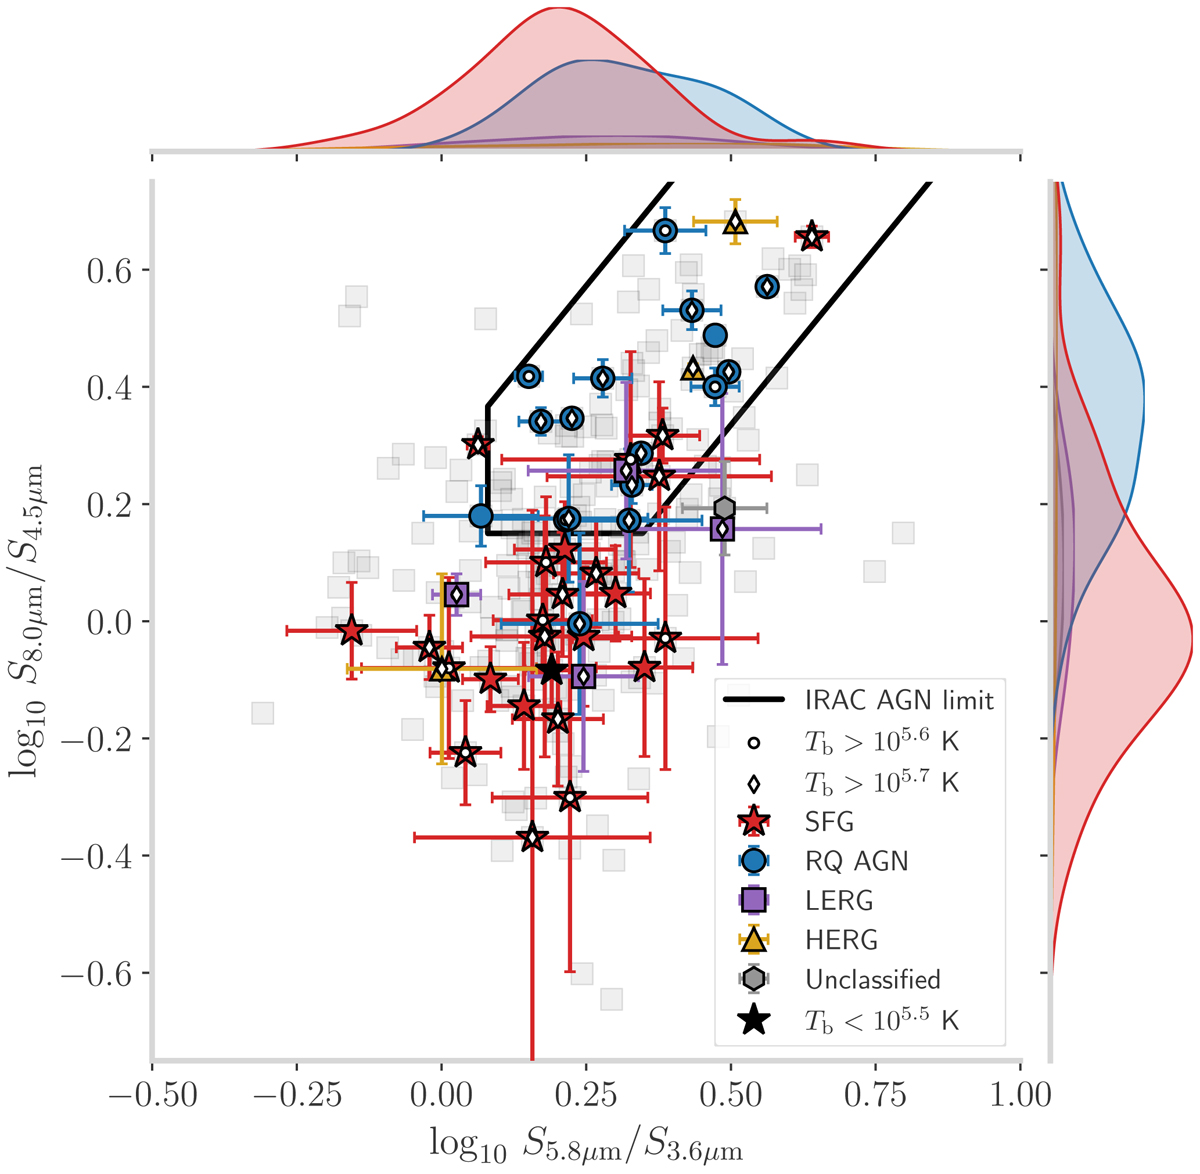
Fig. 10.
Download original image
IRAC colour-colour diagram for LDHD-detected sources. The black line denotes the region in which IRAC AGN are expected, as per the Donley et al. (2012) criteria. Faded grey squares indicate the LDHD-undetected sample, while the coloured symbols indicate LDHD-detected sources. White circles indicate sources with log10Tb > 5.6 and white diamonds indicate sources with log10Tb > 5.7. Sources with no dot or diamond have 5.5 ≤ log10Tb ≤ 5.6, with the exception of the black star, which indicates the single source with log10Tb < 5.5.
Current usage metrics show cumulative count of Article Views (full-text article views including HTML views, PDF and ePub downloads, according to the available data) and Abstracts Views on Vision4Press platform.
Data correspond to usage on the plateform after 2015. The current usage metrics is available 48-96 hours after online publication and is updated daily on week days.
Initial download of the metrics may take a while.