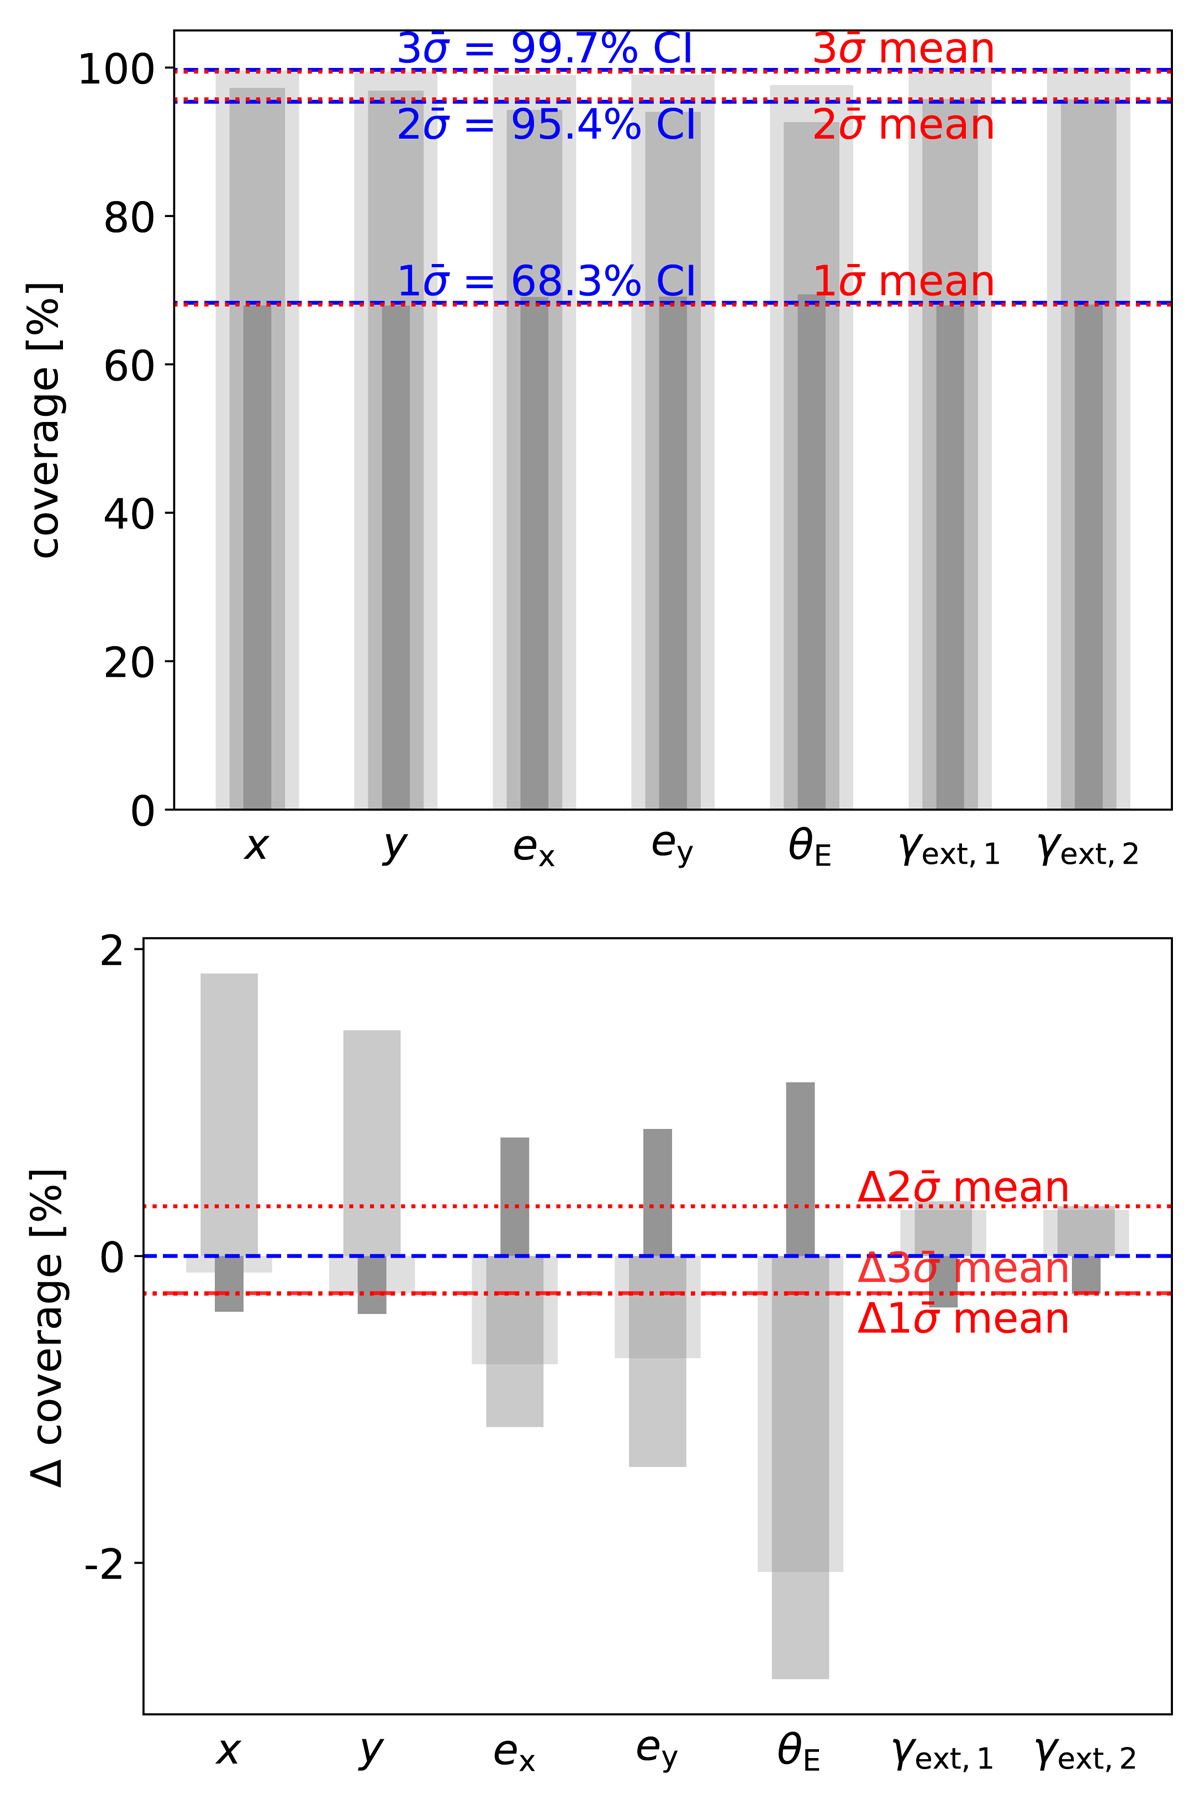
Fig. 6.
Download original image
Coverage of the predicted uncertainties, shown as absolute values (top) and relative values (bottom) to expectations (blue dashed lines). The network-predicted uncertainties σ of the test set were scaled such that roughly 68.3%, 95.4%, and 99.7% of the true values ηtr are contained in the 1σ (dark gray bar), 2σ (median gray bar), and 3σ width (light gray bar) ranges of a Gaussian distribution centered at the predicted median values ηpred. With this scaling, we can indeed interpret the predicted uncertainties of each individual parameter as the width of a Gaussian distribution. We additionally show the mean of all seven σ values, which are, respectively, 68.05%, 95.72%, and 99.46%, in red for comparison.
Current usage metrics show cumulative count of Article Views (full-text article views including HTML views, PDF and ePub downloads, according to the available data) and Abstracts Views on Vision4Press platform.
Data correspond to usage on the plateform after 2015. The current usage metrics is available 48-96 hours after online publication and is updated daily on week days.
Initial download of the metrics may take a while.