Open Access
Fig. 9.
Download original image
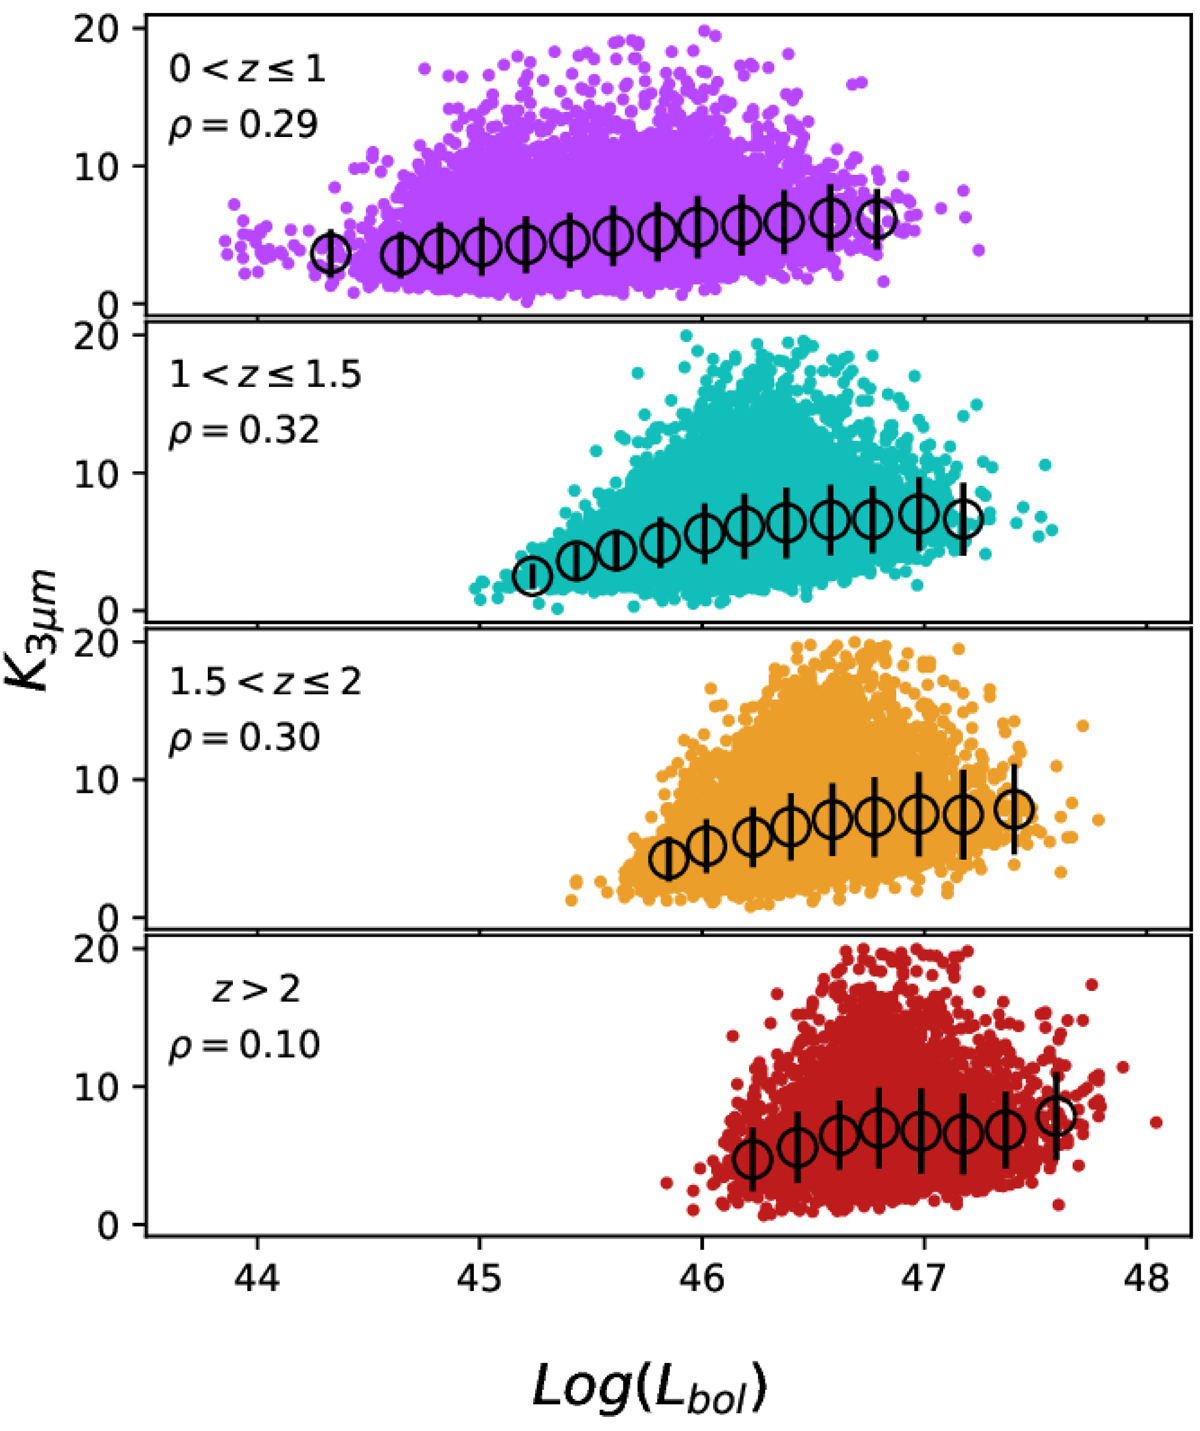
K3 μm for K13 QSOs binned according to their redshift. Black circles give their median values over bins of width 0.2 dex. Each panel shows the QSO redshift range and the coefficient derived via a Spearman correlation test.
Current usage metrics show cumulative count of Article Views (full-text article views including HTML views, PDF and ePub downloads, according to the available data) and Abstracts Views on Vision4Press platform.
Data correspond to usage on the plateform after 2015. The current usage metrics is available 48-96 hours after online publication and is updated daily on week days.
Initial download of the metrics may take a while.