Open Access
Fig. 4.
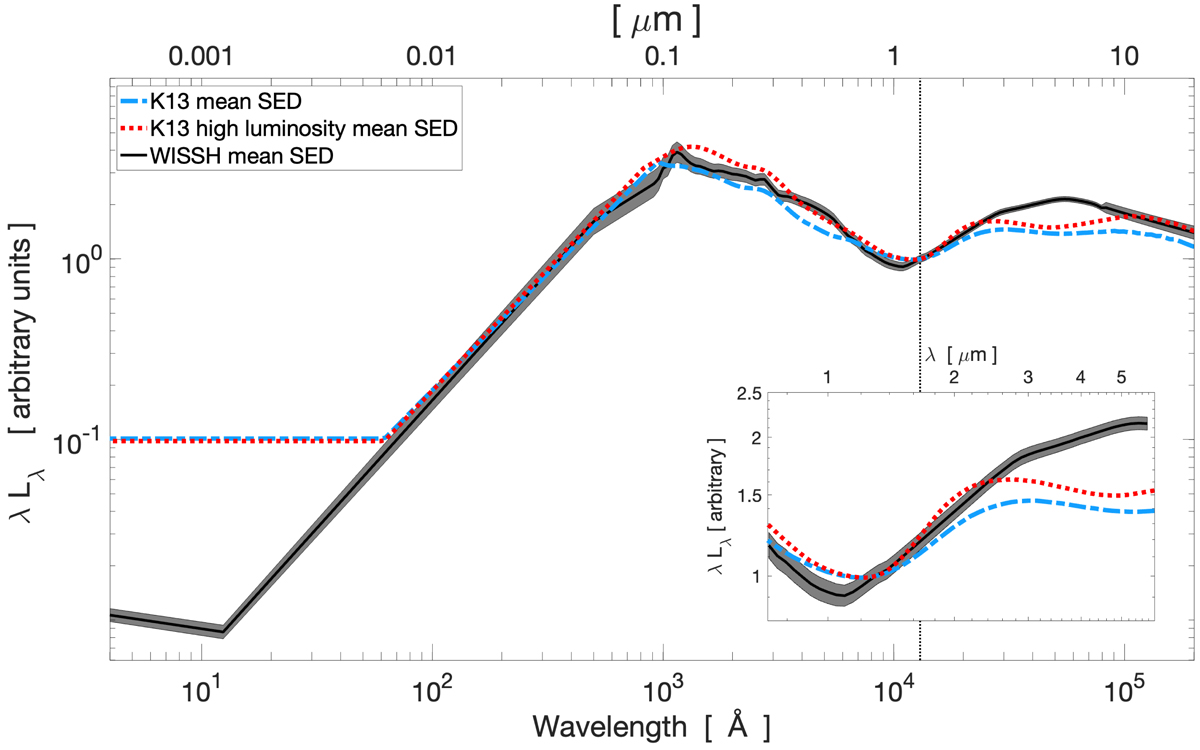
Download original image
Comparison between the WISSH mean SED derived in this work (black line), the overall mean SED for type 1 QSOs by K13 (light blue line), and the high-luminosity SED also by K13 (dotted red line). SEDs are normalized at 1.3 μm (dotted vertical line). The inset shows an image of the SEDs zoomed-in on the 0.7 < λ/μm < 6 range.
Current usage metrics show cumulative count of Article Views (full-text article views including HTML views, PDF and ePub downloads, according to the available data) and Abstracts Views on Vision4Press platform.
Data correspond to usage on the plateform after 2015. The current usage metrics is available 48-96 hours after online publication and is updated daily on week days.
Initial download of the metrics may take a while.