Fig. 10.
Download original image
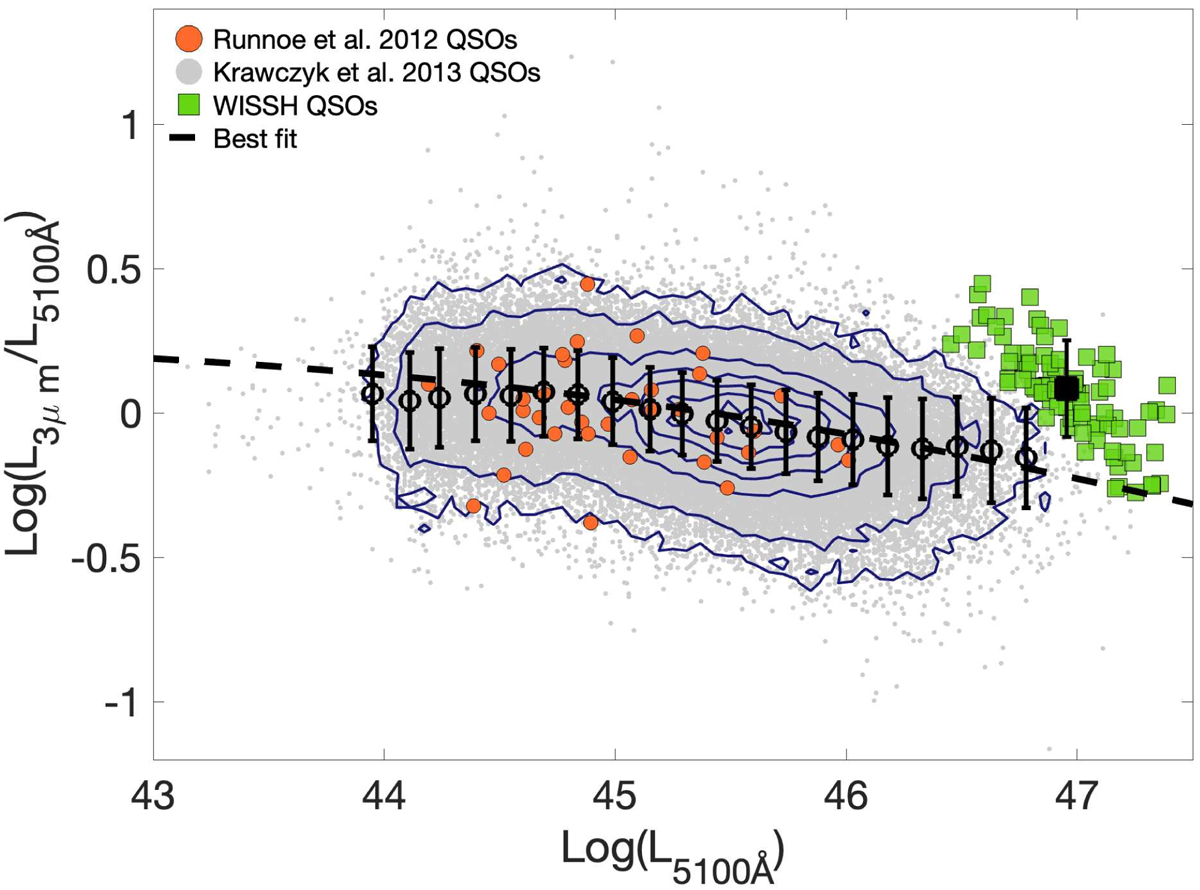
L5100 Å vs. log(L3μm/L5100 Å). QSOs from K13 are included in the plot as gray dots, and their median values over bins of width 0.15 dex are portrayed as black circles. The black dashed line gives the best fit obtained assuming the function described in Sect. 5.4.2. WISSH QSOs are depicted as green squares; the black square shows their median value.
Current usage metrics show cumulative count of Article Views (full-text article views including HTML views, PDF and ePub downloads, according to the available data) and Abstracts Views on Vision4Press platform.
Data correspond to usage on the plateform after 2015. The current usage metrics is available 48-96 hours after online publication and is updated daily on week days.
Initial download of the metrics may take a while.