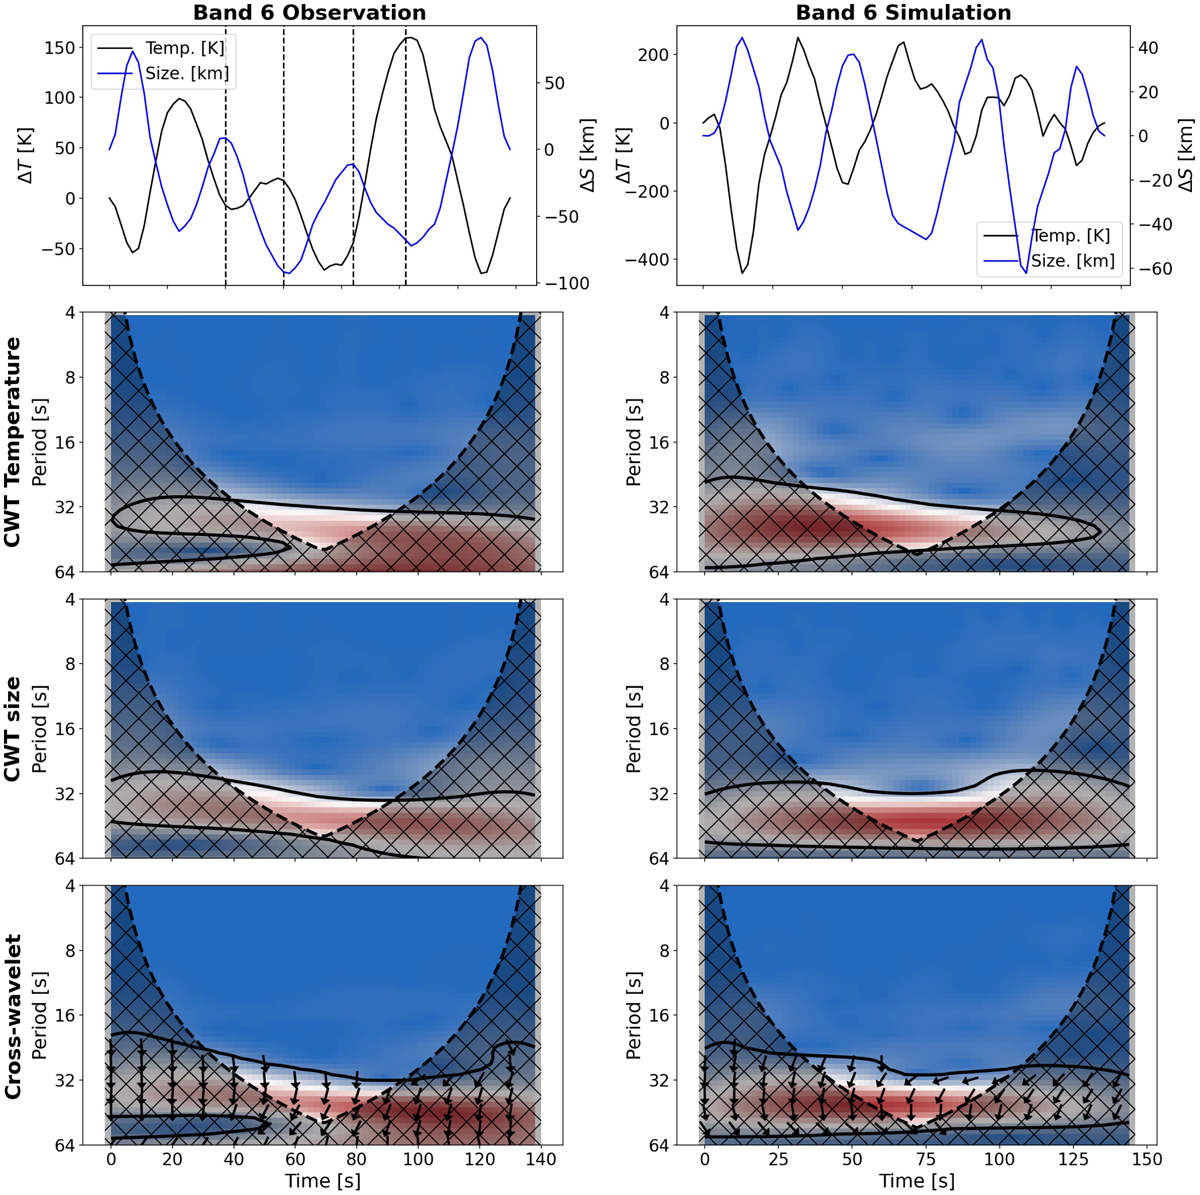
Fig. 8.
Download original image
Temperature and size oscillations of an example feature in Band 6 observation (left column) and degradedsimulation (right column) are shown in the top row. From the second row to bottom the continuous wavelets for temperature, size and the cross-wavelet for the same two quantities are shown. For these panels the period is plotted using a log2 scale in the y-axis and time is shown in x-axis. The hashed black region highlights the cone of influence for each spectrum and the black solid lines mark the 95% confidence levels. The arrows in the bottom panels depict the phase difference between temperature and size oscillations, being in-phase when arrows point straight up, anti-phase when arrows point straight down, pointing to the left indicate that perturbation of temperature follows those of size and vice versa when pointing to the right.
Current usage metrics show cumulative count of Article Views (full-text article views including HTML views, PDF and ePub downloads, according to the available data) and Abstracts Views on Vision4Press platform.
Data correspond to usage on the plateform after 2015. The current usage metrics is available 48-96 hours after online publication and is updated daily on week days.
Initial download of the metrics may take a while.