Fig. 6.
Download original image
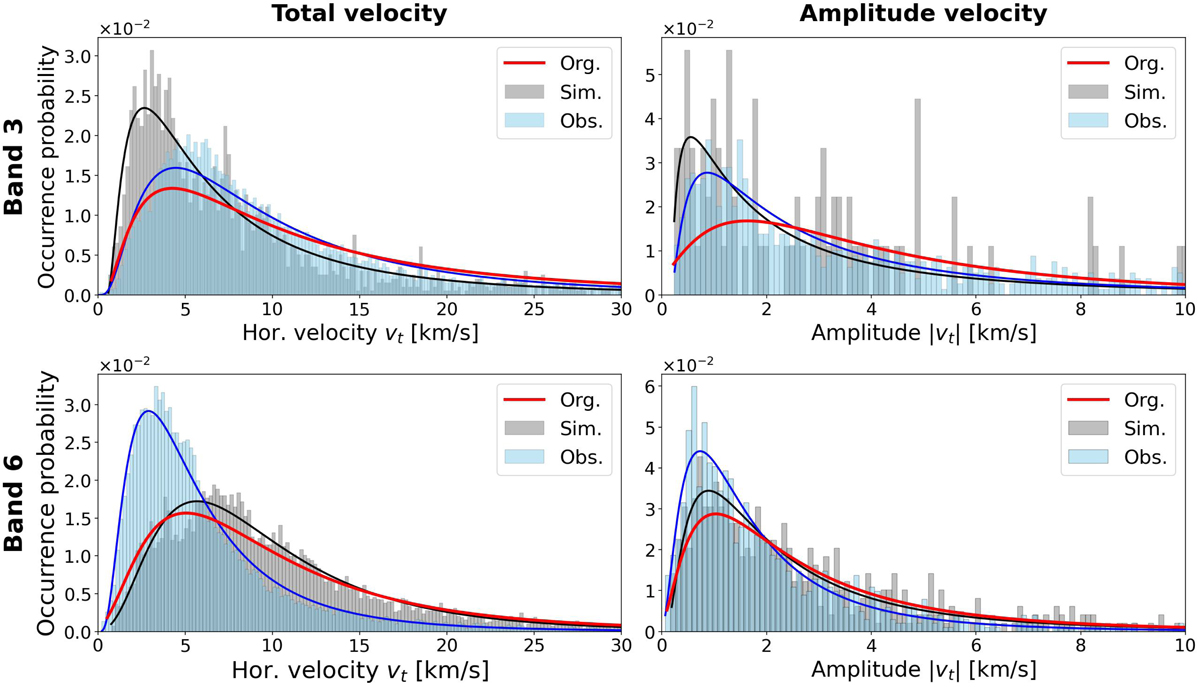
Distributions of total horizontal velocities (left column) and amplitude velocities (right column) for degraded simulations (grey) and observations (blue) in the features found and traced in Bands 3 (top row) and 6 (bottom row). The blue and black solid lines correspond to a log-norm fit in each corresponding case. The red solid lines correspond to the log-norm fits of the results from the simulation at the original resolution.
Current usage metrics show cumulative count of Article Views (full-text article views including HTML views, PDF and ePub downloads, according to the available data) and Abstracts Views on Vision4Press platform.
Data correspond to usage on the plateform after 2015. The current usage metrics is available 48-96 hours after online publication and is updated daily on week days.
Initial download of the metrics may take a while.