Fig. 4.
Download original image
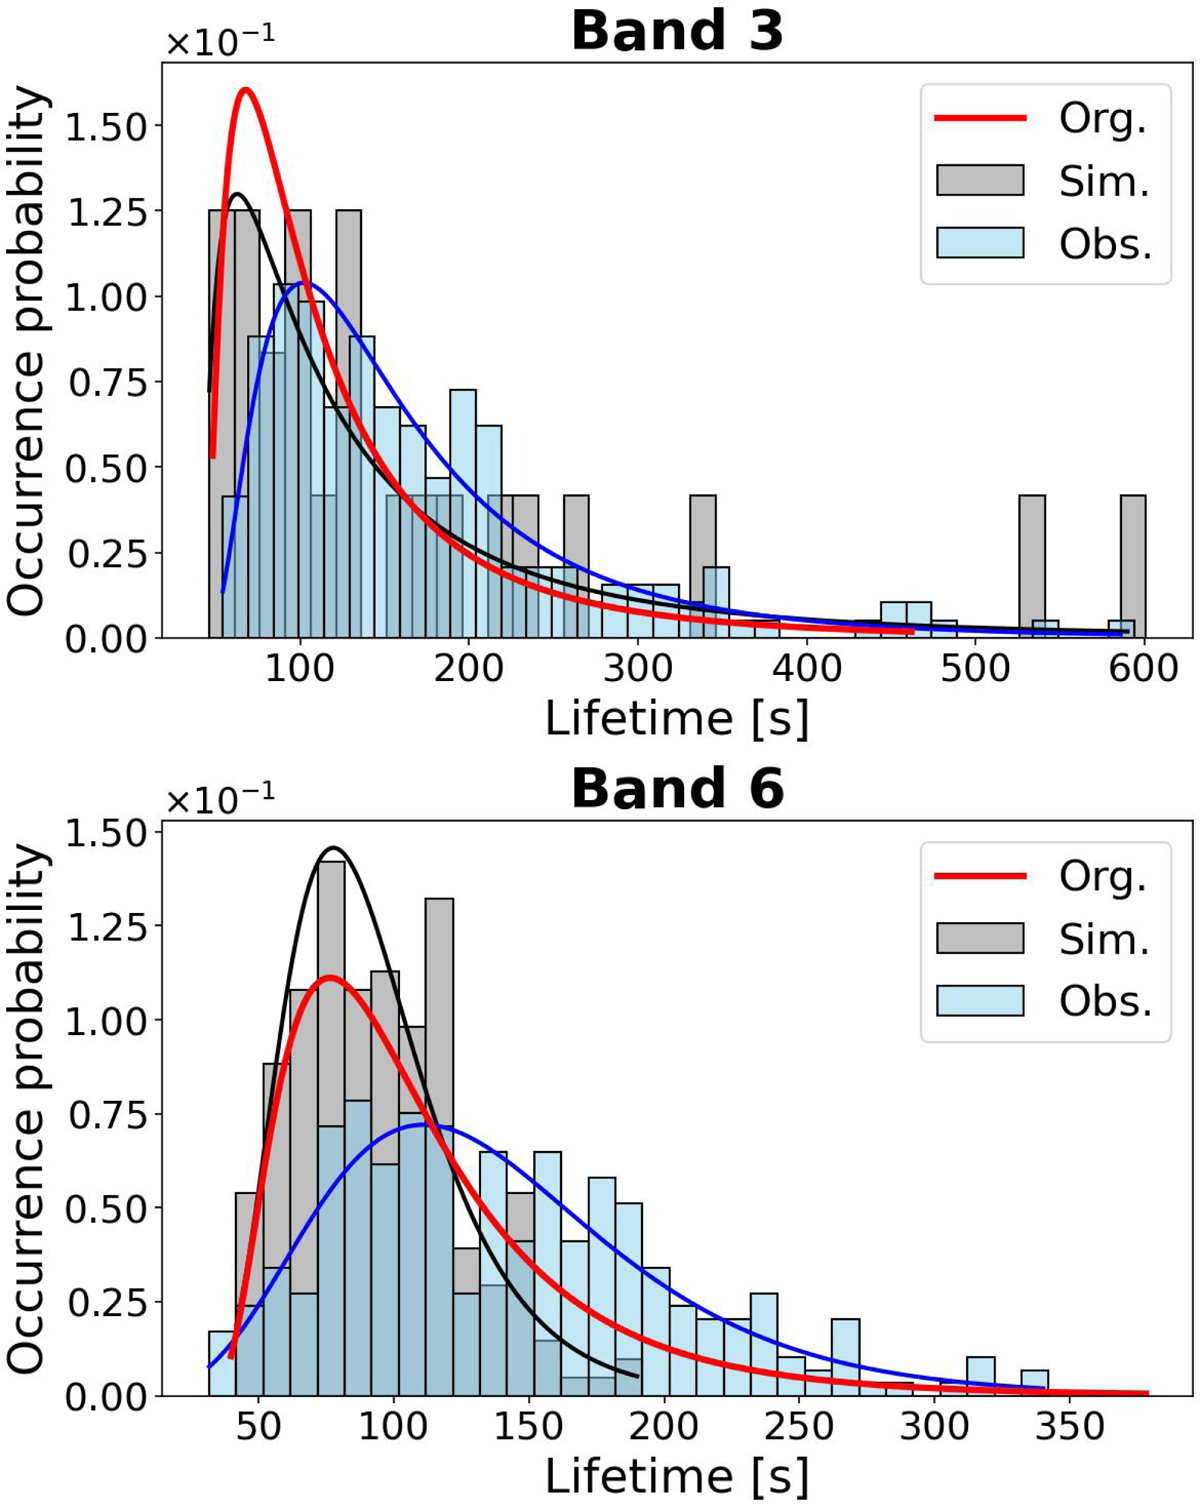
Distribution of lifetimes for all the features for Band 3 (top) and Band 6 (bottom). In both panels, the blue histograms correspond to results from observations and the grey to results from degraded simulations. The solid lines are their corresponding log-norm fits. The red solid line corresponds to the log-norm fit of the results from the simulation at the original resolution.
Current usage metrics show cumulative count of Article Views (full-text article views including HTML views, PDF and ePub downloads, according to the available data) and Abstracts Views on Vision4Press platform.
Data correspond to usage on the plateform after 2015. The current usage metrics is available 48-96 hours after online publication and is updated daily on week days.
Initial download of the metrics may take a while.