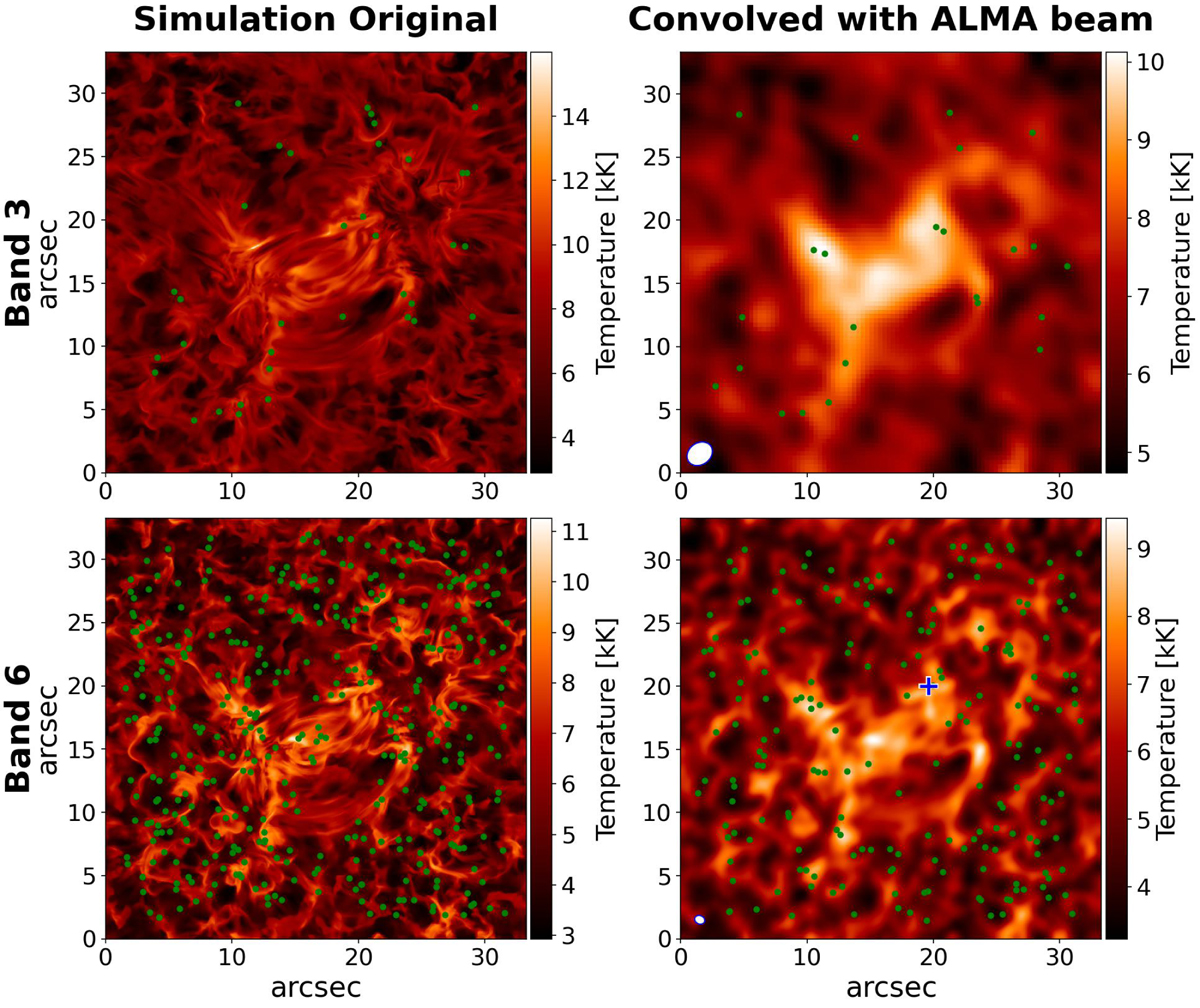
Fig. 2.
Download original image
Snapshots at the same time from Bifrost simulation for the synthetic ALMA Band 3 and 6 are shown in the top and bottom rows, respectively. Left column corresponds to original snapshots with full resolution. Right column shows the result of convolving and matching with ALMA Beam and pixel size. The green dots mark the median position of all analysed features. The blue cross by (20,20) arcsec in the Band 6 degraded simulation shows the position of the example feature.
Current usage metrics show cumulative count of Article Views (full-text article views including HTML views, PDF and ePub downloads, according to the available data) and Abstracts Views on Vision4Press platform.
Data correspond to usage on the plateform after 2015. The current usage metrics is available 48-96 hours after online publication and is updated daily on week days.
Initial download of the metrics may take a while.