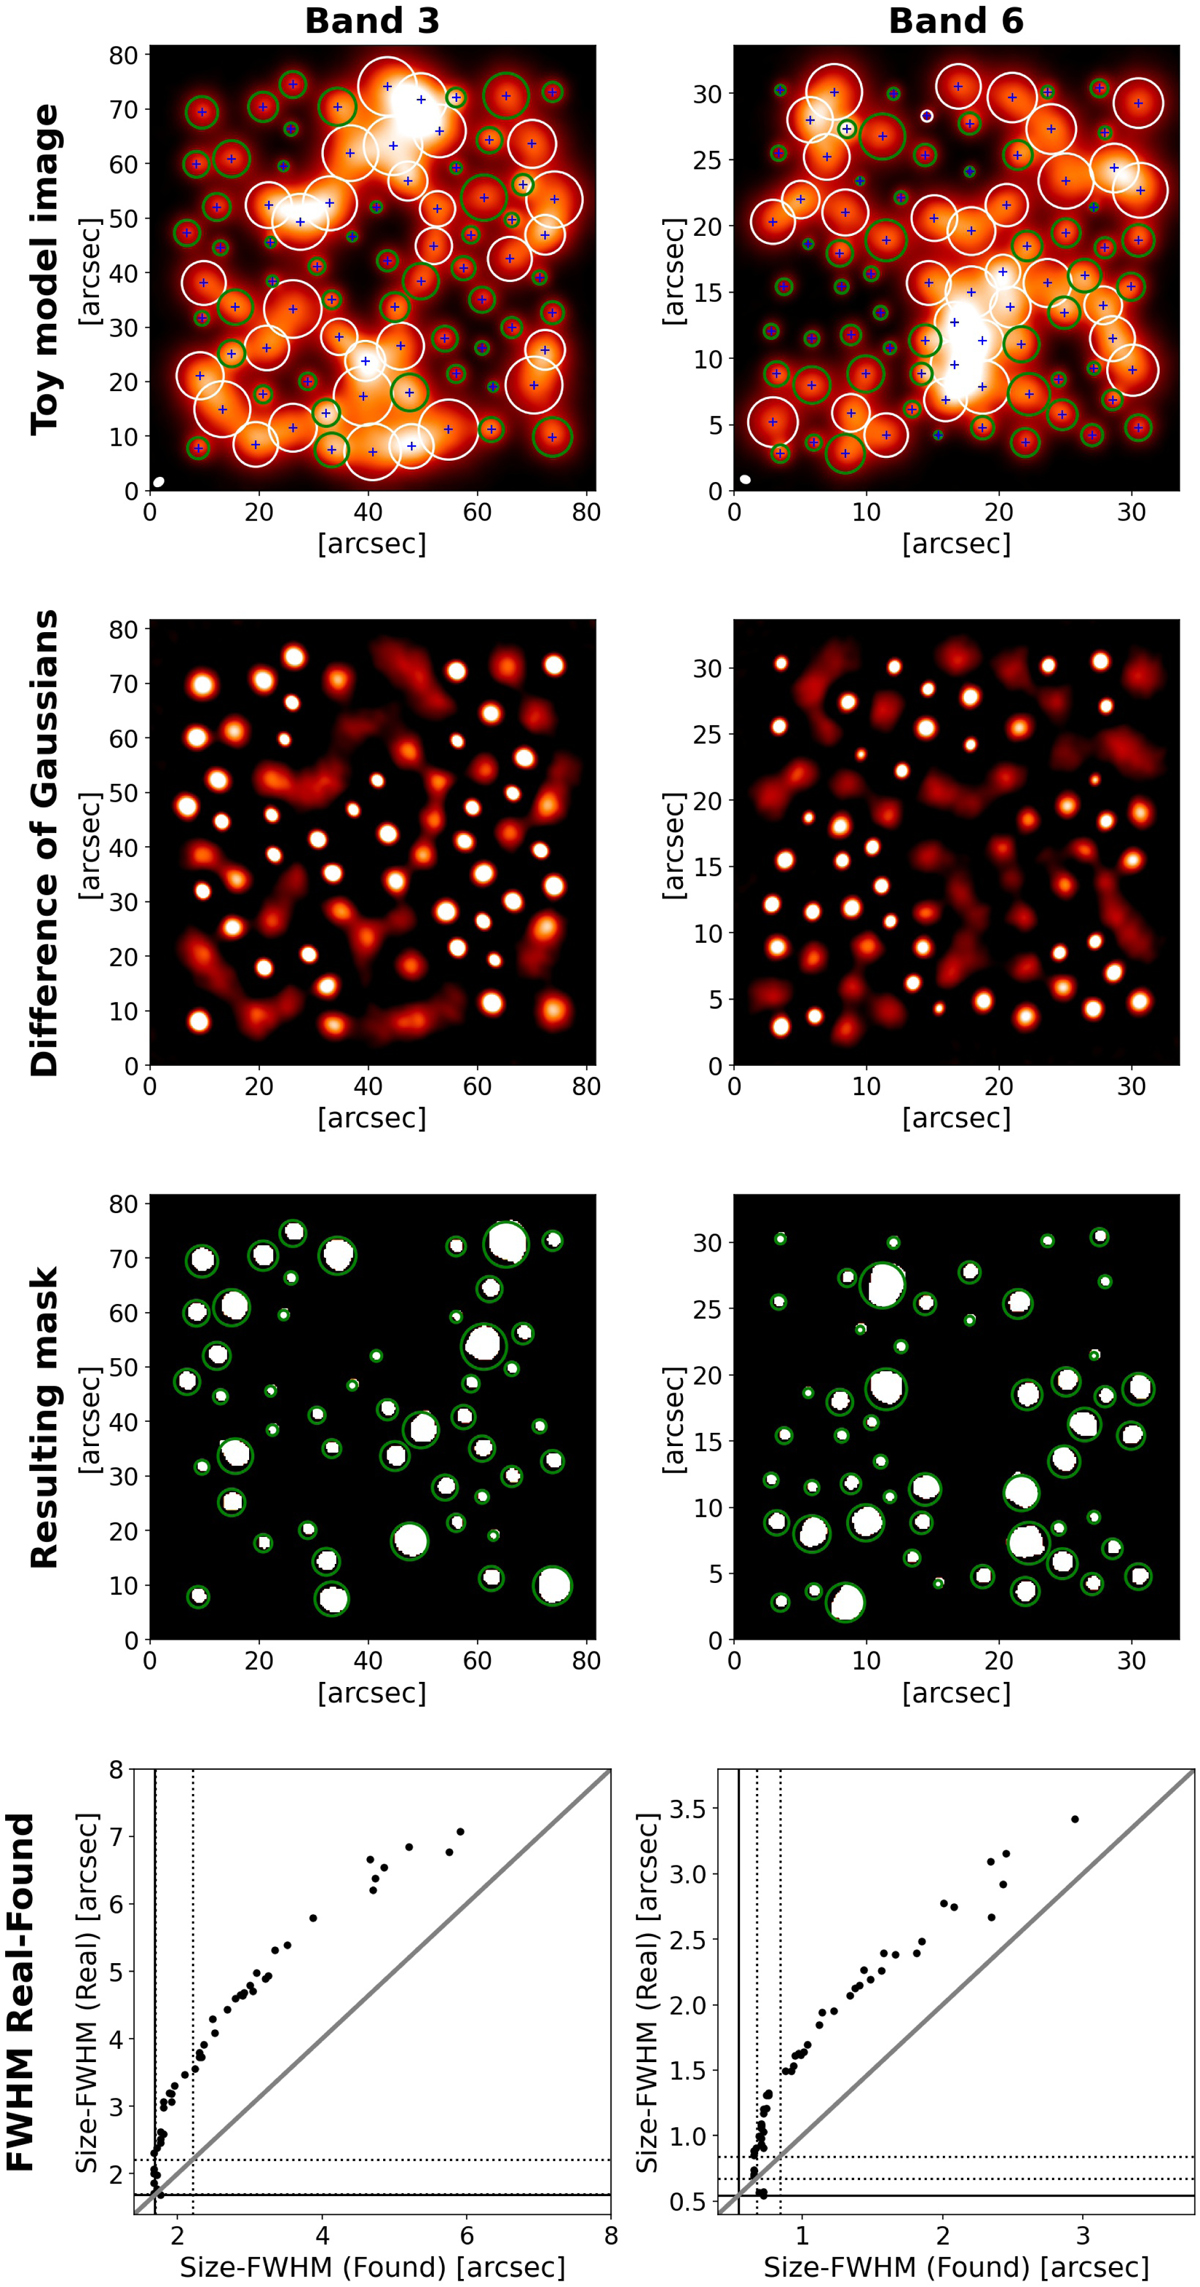
Fig. A.1.
Download original image
Toy model images for bands 3 and 6 (top panel). Blue crosses represent the centre location of fake features, green circles show those features picked up by the algorithm and white circles those features that were not picked up. The small white ellipses in the bottom left corner show the ALMA beam shape. Second panel shows the difference of Gaussians in each case. Third panel shows the resulting masks and green circles as same as in top panel. Bottom panel shows the relation between real size of the feature and the size found by the algorithm.
Current usage metrics show cumulative count of Article Views (full-text article views including HTML views, PDF and ePub downloads, according to the available data) and Abstracts Views on Vision4Press platform.
Data correspond to usage on the plateform after 2015. The current usage metrics is available 48-96 hours after online publication and is updated daily on week days.
Initial download of the metrics may take a while.