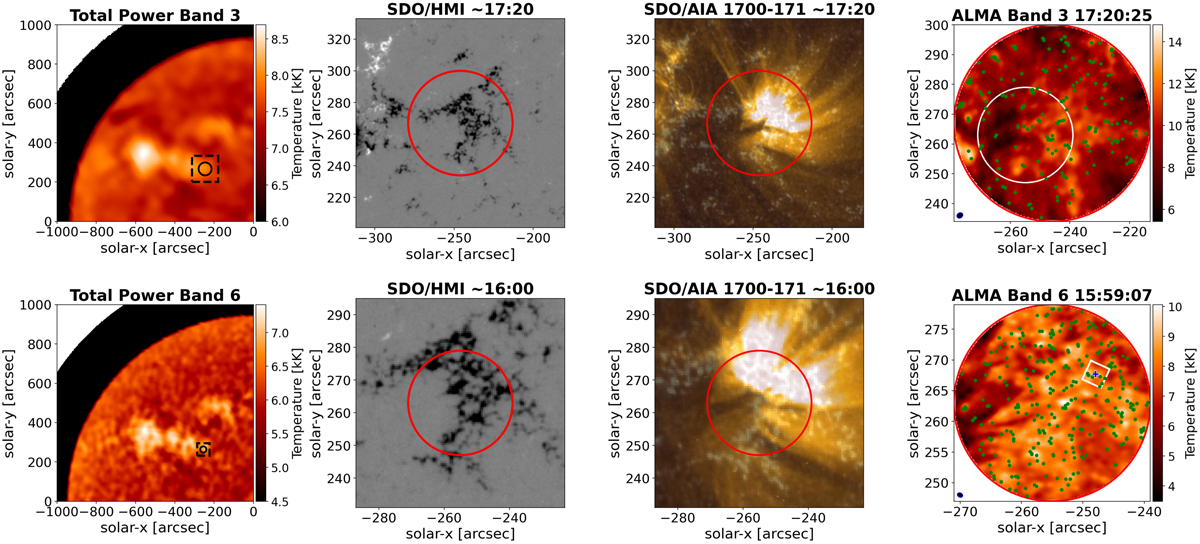
Fig. 1.
Download original image
Total power or full-disk map in ALMA Band 3 (top row from left to right). Small black dashed square delimits the region showed in SDO/HMI and SDO/AIA 1700-171 and the small black circle depicts the ALMA Band 3 interferometric FoV, SDO/HMI image showing the presence of magnetic field in the ALMA FoV indicated by the red circle, SDO/AIA 170-17.1 nm composite image of the same region, ALMA Band 3 image in which the green dots indicate the median location of all analysed feature and the white circle shows the ALMA Band 6 FoV. Bottom row: same as in the top row but for Band 6, in the ALMA Band 6 image, the small white square with the blue cross in the centre signalise the location of the example feature used in this paper. The small black ellipse in the bottom-left corner of ALMA images show their respective beam shapes.
Current usage metrics show cumulative count of Article Views (full-text article views including HTML views, PDF and ePub downloads, according to the available data) and Abstracts Views on Vision4Press platform.
Data correspond to usage on the plateform after 2015. The current usage metrics is available 48-96 hours after online publication and is updated daily on week days.
Initial download of the metrics may take a while.