Fig. 4.
Download original image
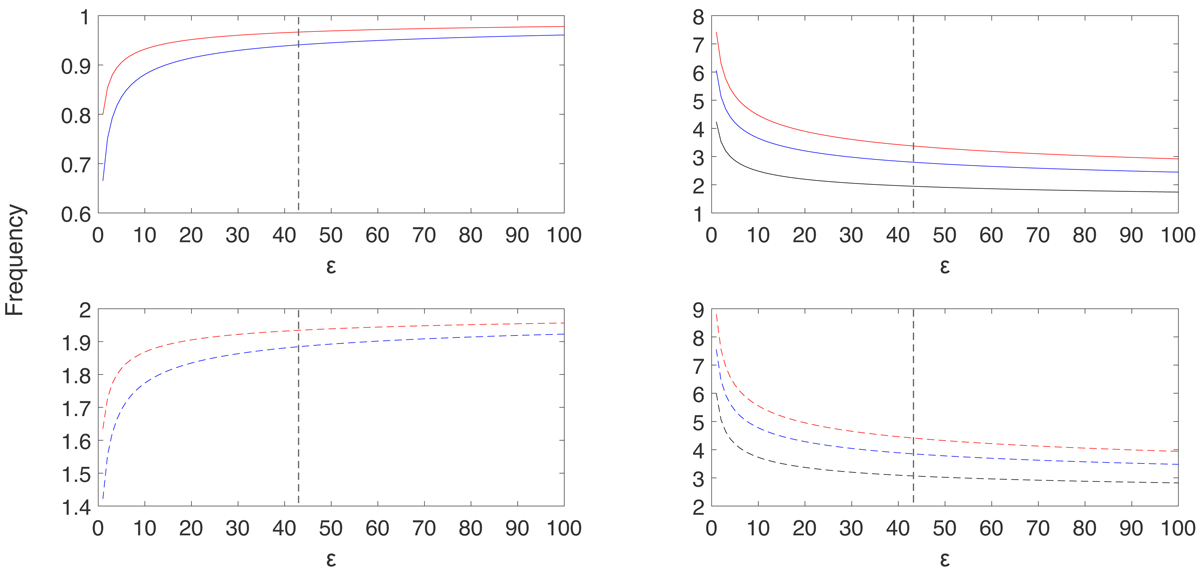
Wave frequency in the inertial frame as expected to be seen by observations vs. ε. The frequency was normalised by the angular frequency of a star, Ω. Black, blue, and red curves correspond to the modes with l = 0, l = 2, and l = 4, respectively. The left panels display the Rossby modes with m = 1 (solid lines, upper panel) and m = 2 (dashed lines, lower panel). The upper (lower) right panel shows inertia-Gravity modes (Rossby-gravity modes). Grey dashed lines denote the value of ε calculated for the solar parameters and the equivalent depth of h = 0.0064 H0.
Current usage metrics show cumulative count of Article Views (full-text article views including HTML views, PDF and ePub downloads, according to the available data) and Abstracts Views on Vision4Press platform.
Data correspond to usage on the plateform after 2015. The current usage metrics is available 48-96 hours after online publication and is updated daily on week days.
Initial download of the metrics may take a while.