Open Access
Fig. 2.
Download original image
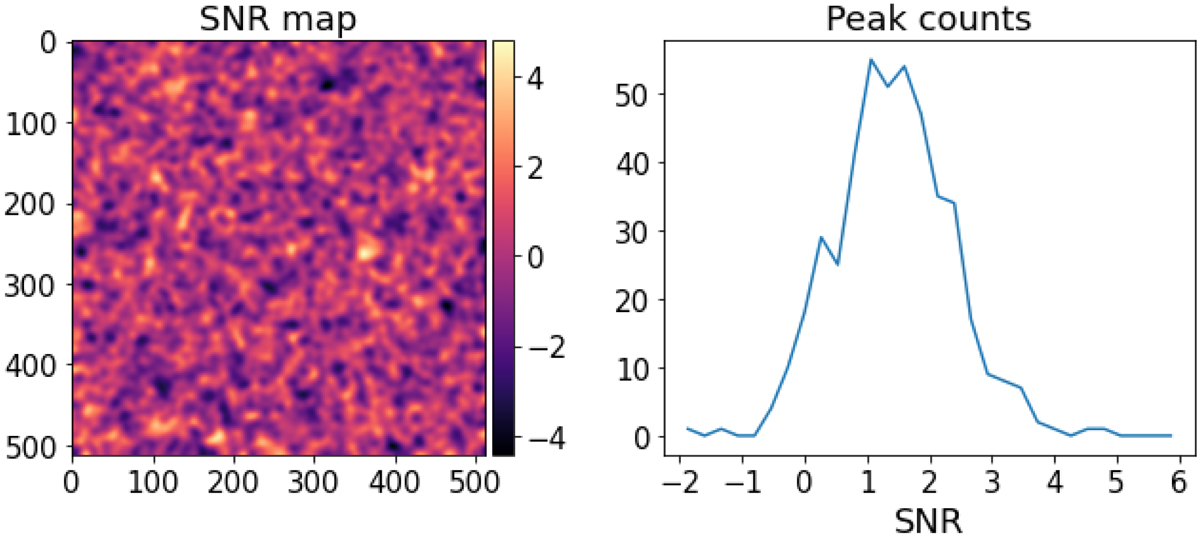
S/N map and peak counts histogram. The left plot is the S/N map of a part of the 512 × 512 pixels of CFIS-UNIONS data. The right plot is the peak counts computed on that S/N map.
Current usage metrics show cumulative count of Article Views (full-text article views including HTML views, PDF and ePub downloads, according to the available data) and Abstracts Views on Vision4Press platform.
Data correspond to usage on the plateform after 2015. The current usage metrics is available 48-96 hours after online publication and is updated daily on week days.
Initial download of the metrics may take a while.