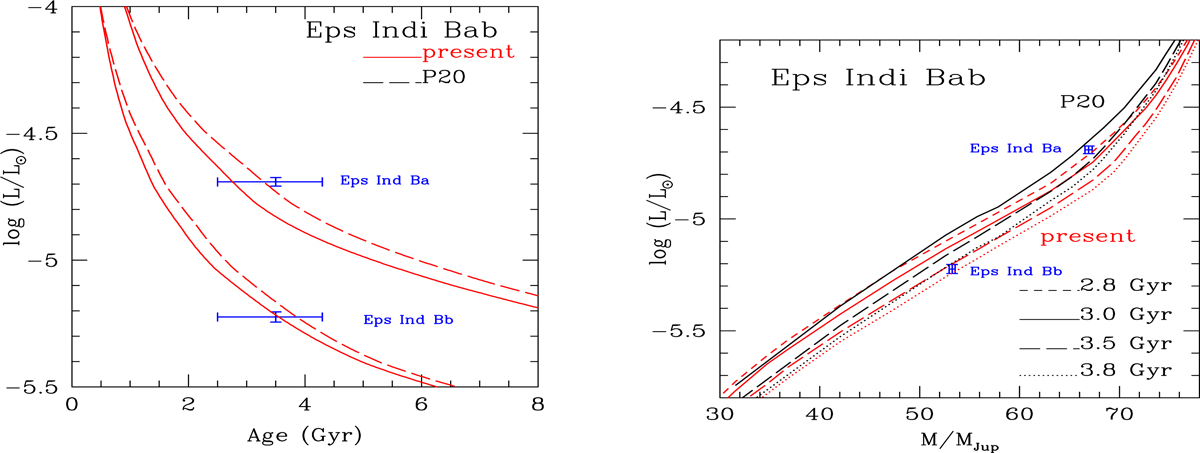
Fig. 4.
Download original image
Left: cooling curves for a 67 MJup (top) and a 53 MJup (bottom) BD, respectively, representative of the ϵ Ind Bab system. The solid line shows the present models based on the CD21 EOS; while the dashed line shows the Phillips et al. (2020) models based on the CMS19 EOS. Right: BD isochrones typical of the inferred age of the ϵ Ind Bab system, calculated with the present (red) and Phillips et al. (2020) (black) models.
Current usage metrics show cumulative count of Article Views (full-text article views including HTML views, PDF and ePub downloads, according to the available data) and Abstracts Views on Vision4Press platform.
Data correspond to usage on the plateform after 2015. The current usage metrics is available 48-96 hours after online publication and is updated daily on week days.
Initial download of the metrics may take a while.