Fig. 1.
Download original image
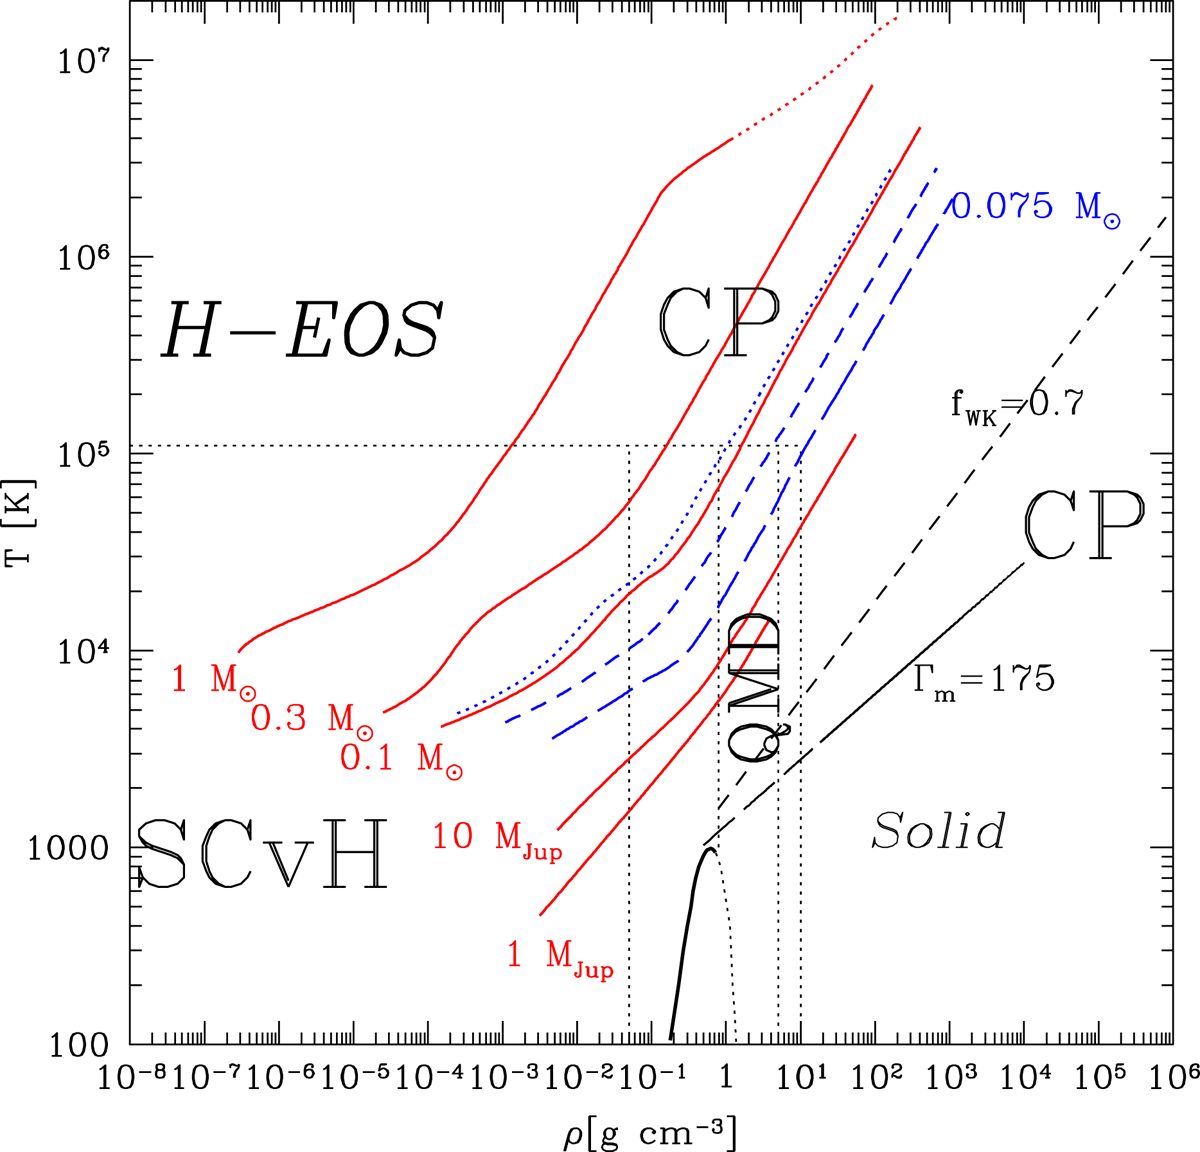
Interior T − ρ profiles in the hydrogen phase diagram for different astrophysical bodies at about 5 Gyr, as labelled in the figure (red lines), and for a 0.075 M⊙ object at 108, 8 × 10⁸ and 8 × 10⁹ yr (blue dotted, short-dashed and long-dashed lines, respectively). The SCvH, CP, and QMD labels stand for Saumon et al. (1995) EOS, Chabrier & Potekhin (1998) EOS, and QMD simulations. The line fWK correponds to the onset of quantum (diffration) effects on the ions while Γm delineates the hydrogen melting line (see Chabrier et al. 2019 and Chabrier & Debras 2021 for details).
Current usage metrics show cumulative count of Article Views (full-text article views including HTML views, PDF and ePub downloads, according to the available data) and Abstracts Views on Vision4Press platform.
Data correspond to usage on the plateform after 2015. The current usage metrics is available 48-96 hours after online publication and is updated daily on week days.
Initial download of the metrics may take a while.