Fig. 7
Download original image
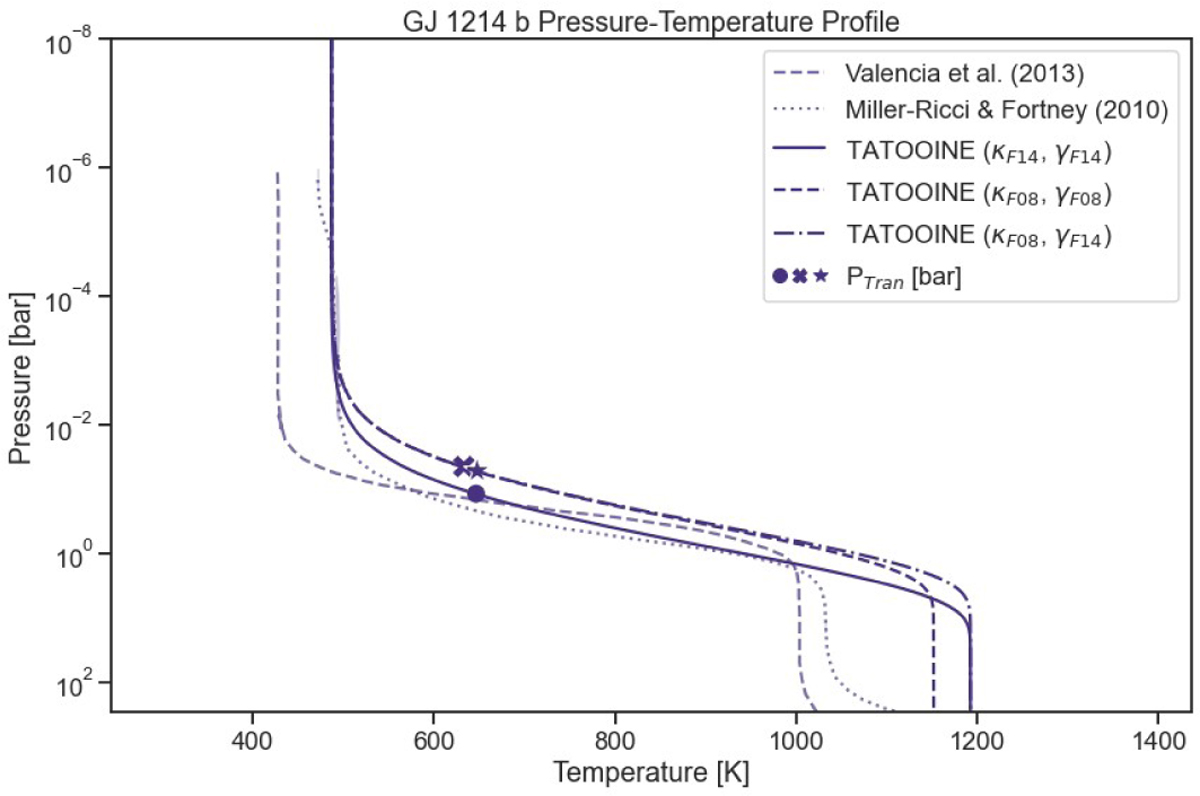
Atmospheric temperature profiles for GJ 1214 b calculated using the median values from the parameter study runs in Fig. 4 (solid), Fig. 6a (thick dashed), and Fig. 6b (thick dash-dotted) compared to the profiles from Valencia et al. (2013; thin dashed) and Miller-Ricci & Fortney (2010; thin dotted). The transit pressures (PTran) are marked as solid symbols and the associated RTran values can be found in Table B.3.
Current usage metrics show cumulative count of Article Views (full-text article views including HTML views, PDF and ePub downloads, according to the available data) and Abstracts Views on Vision4Press platform.
Data correspond to usage on the plateform after 2015. The current usage metrics is available 48-96 hours after online publication and is updated daily on week days.
Initial download of the metrics may take a while.