Open Access
Fig. 5
Download original image
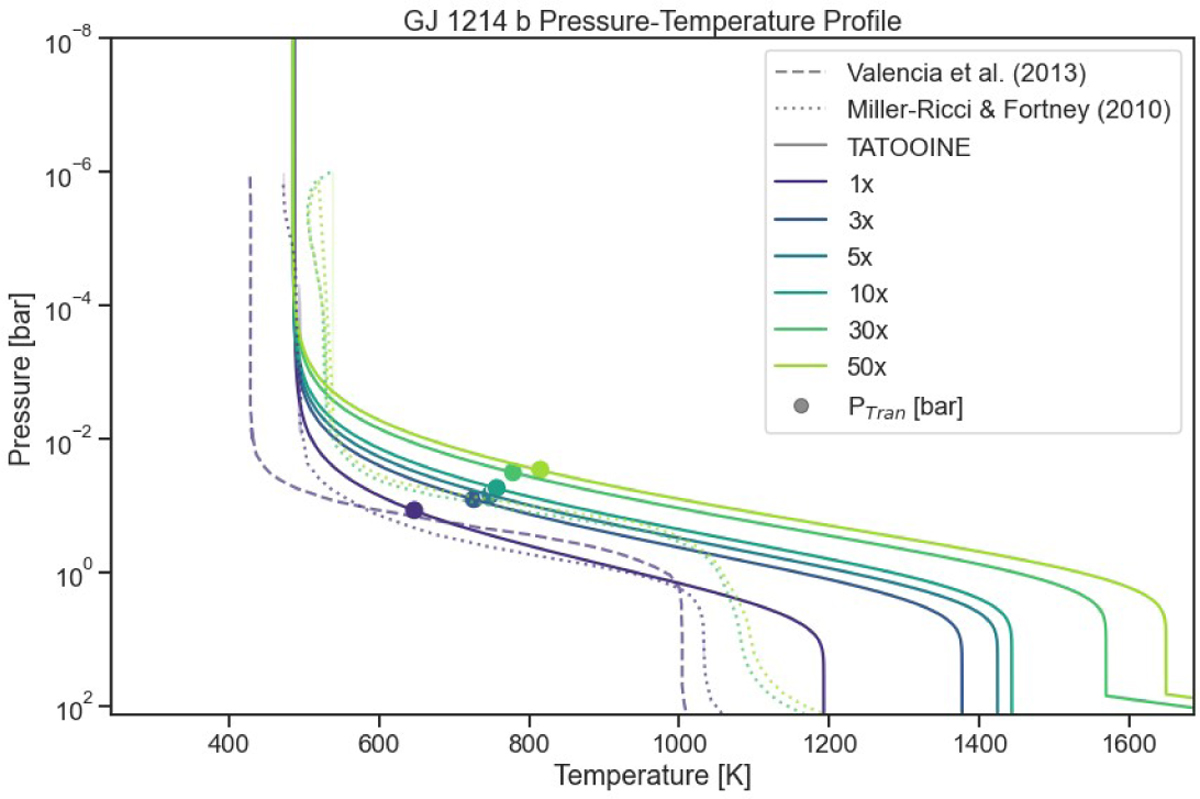
Atmospheric pressure-temperature profiles and transit pressures (see Table B.3 for RTran values) for GJ 1214 b for all metallicities available in F14 (solid lines), compared with profiles from Valencia et al. (2013) and Miller-Ricci & Fortney (2010; dashed lines). See Fig. A.1 for the associated corner plots.
Current usage metrics show cumulative count of Article Views (full-text article views including HTML views, PDF and ePub downloads, according to the available data) and Abstracts Views on Vision4Press platform.
Data correspond to usage on the plateform after 2015. The current usage metrics is available 48-96 hours after online publication and is updated daily on week days.
Initial download of the metrics may take a while.