Open Access
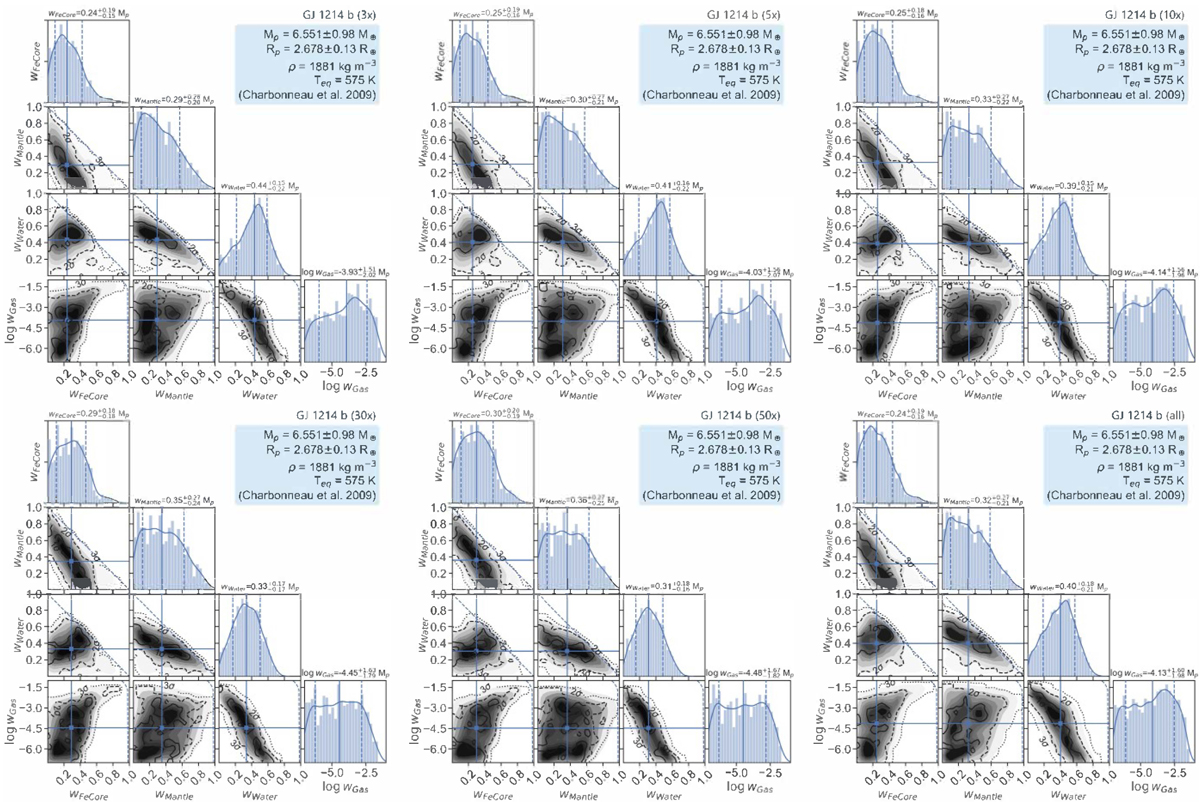
Fig. A.1
Download original image
Corner plots for GJ 1214 b showing the distribution of interior solutions for each atmospheric metallicity as shown in Table B.2. The 1x metallicity plot is shown in Sect. 4.2, Fig. 4. The bottom right panel is an aggregate plot that includes the solutions from all metallicities. See Table B.3 for median values.
Current usage metrics show cumulative count of Article Views (full-text article views including HTML views, PDF and ePub downloads, according to the available data) and Abstracts Views on Vision4Press platform.
Data correspond to usage on the plateform after 2015. The current usage metrics is available 48-96 hours after online publication and is updated daily on week days.
Initial download of the metrics may take a while.