Fig. 4
Download original image
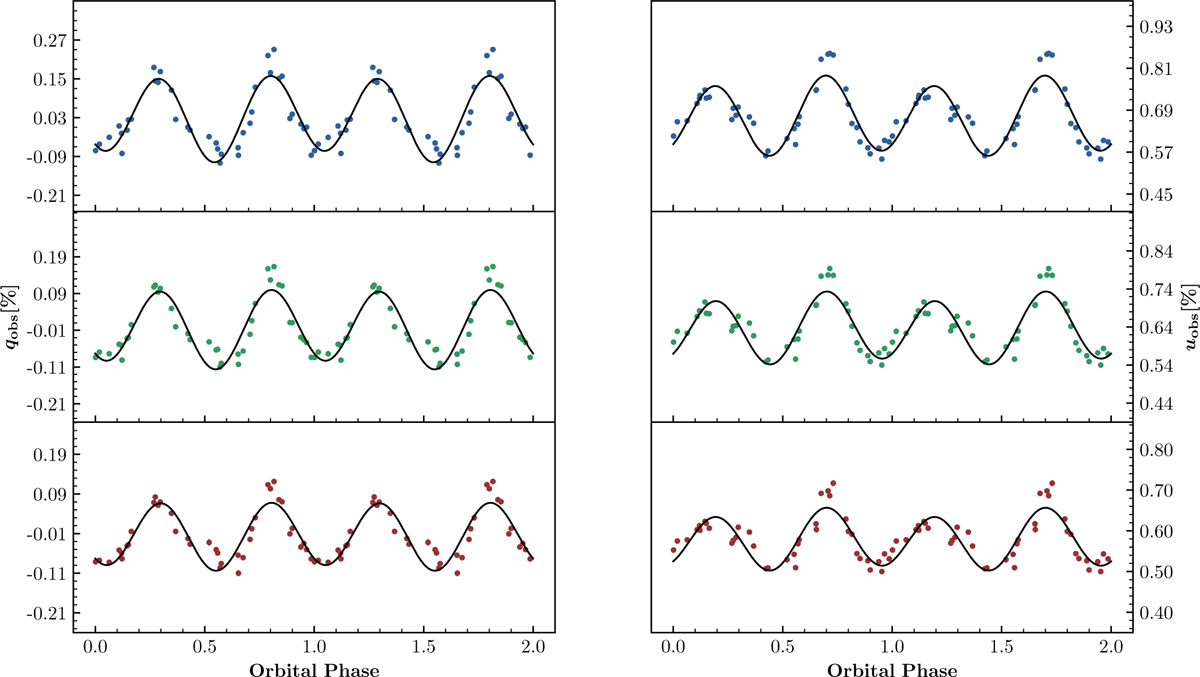
Variability of observed Stokes q and u parameters for AO Cas in B, V, and R passbands shown in the top, middle, and bottom panels, respectively, which are phase-folded at the orbital period of 3.52 days. Fourier fit curves (see Sect. 3.3) are shown in solid lines and the best fit Fourier coefficients are given in Table 5. For the majority of data points, the length of ±σ error bars is shorter than the size of the plotting symbols.
Current usage metrics show cumulative count of Article Views (full-text article views including HTML views, PDF and ePub downloads, according to the available data) and Abstracts Views on Vision4Press platform.
Data correspond to usage on the plateform after 2015. The current usage metrics is available 48-96 hours after online publication and is updated daily on week days.
Initial download of the metrics may take a while.