Fig. A.1.
Download original image
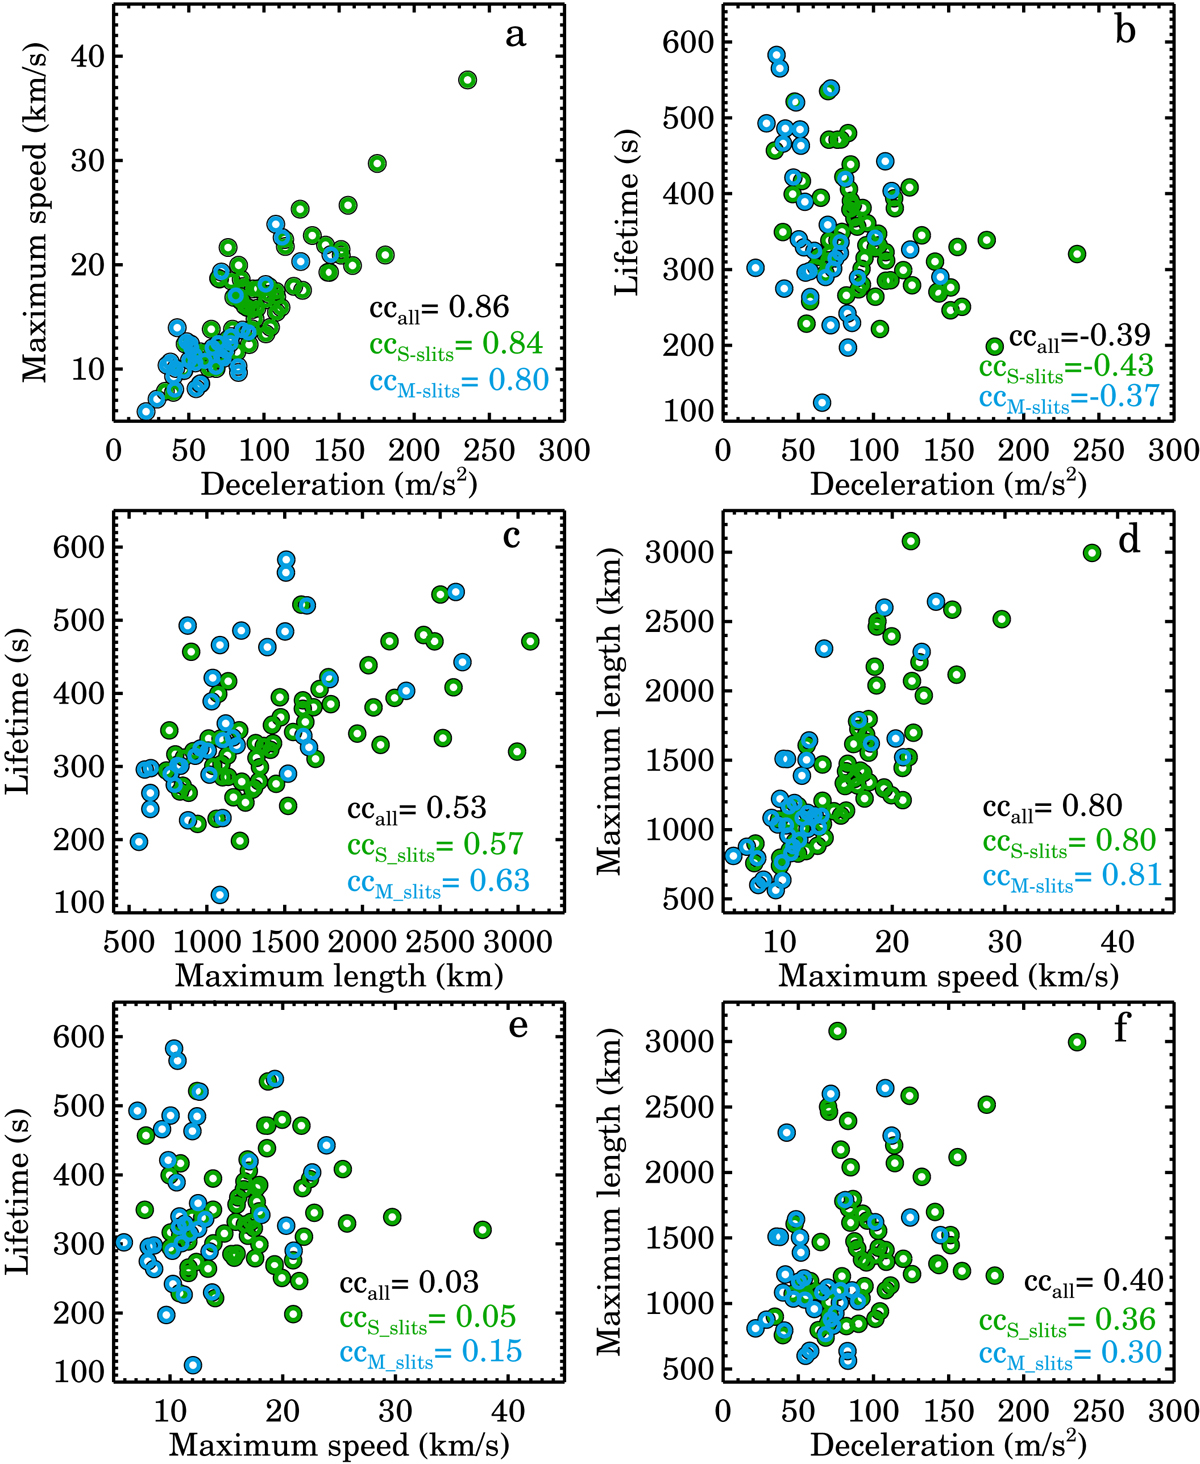
Correlation analysis between different parameters of the fitted parabolas of EUV dynamic fibrils. Derived correlation coefficients (cc) for all three cases, i.e. for all slits, only S slits, and only M slits, are also printed on each panel. The green and blue circles represent DFs from the S slits and M slits, respectively.
Current usage metrics show cumulative count of Article Views (full-text article views including HTML views, PDF and ePub downloads, according to the available data) and Abstracts Views on Vision4Press platform.
Data correspond to usage on the plateform after 2015. The current usage metrics is available 48-96 hours after online publication and is updated daily on week days.
Initial download of the metrics may take a while.