Fig. 8
Download original image
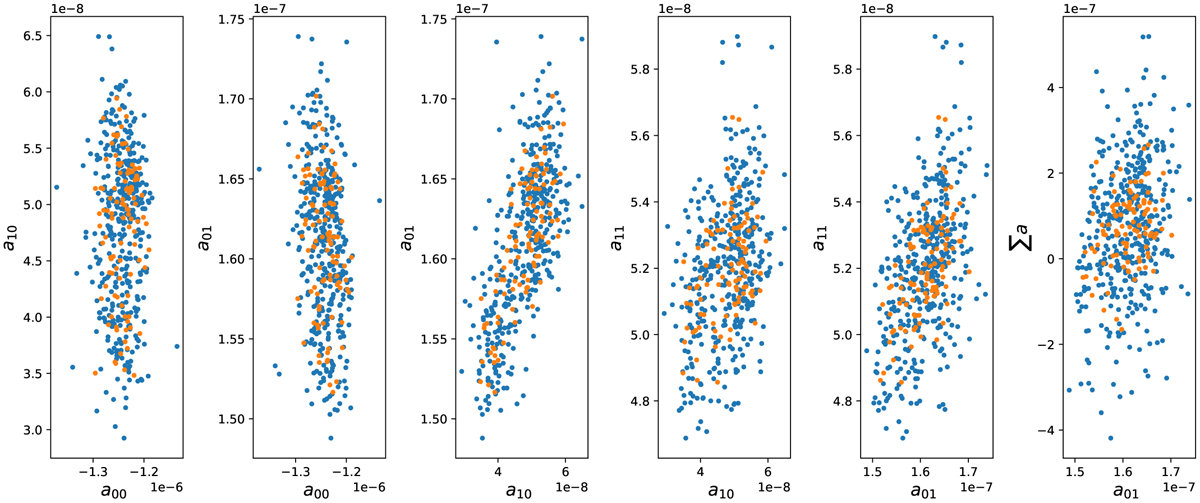
Distribution of area coefficients over the ~400 hundred channels of HSC (blue) and the averages over each sensor (orange). All aij coefficients are expressed in el−1. We may note that the trends for channels and sensors are similar, which indicates some homogeneity within sensors (except for Σ a, where the scatter is dominated by shot noise). Σ a is the sum for −10 < i, j < 10.
Current usage metrics show cumulative count of Article Views (full-text article views including HTML views, PDF and ePub downloads, according to the available data) and Abstracts Views on Vision4Press platform.
Data correspond to usage on the plateform after 2015. The current usage metrics is available 48-96 hours after online publication and is updated daily on week days.
Initial download of the metrics may take a while.