Open Access
Fig. 23
Download original image
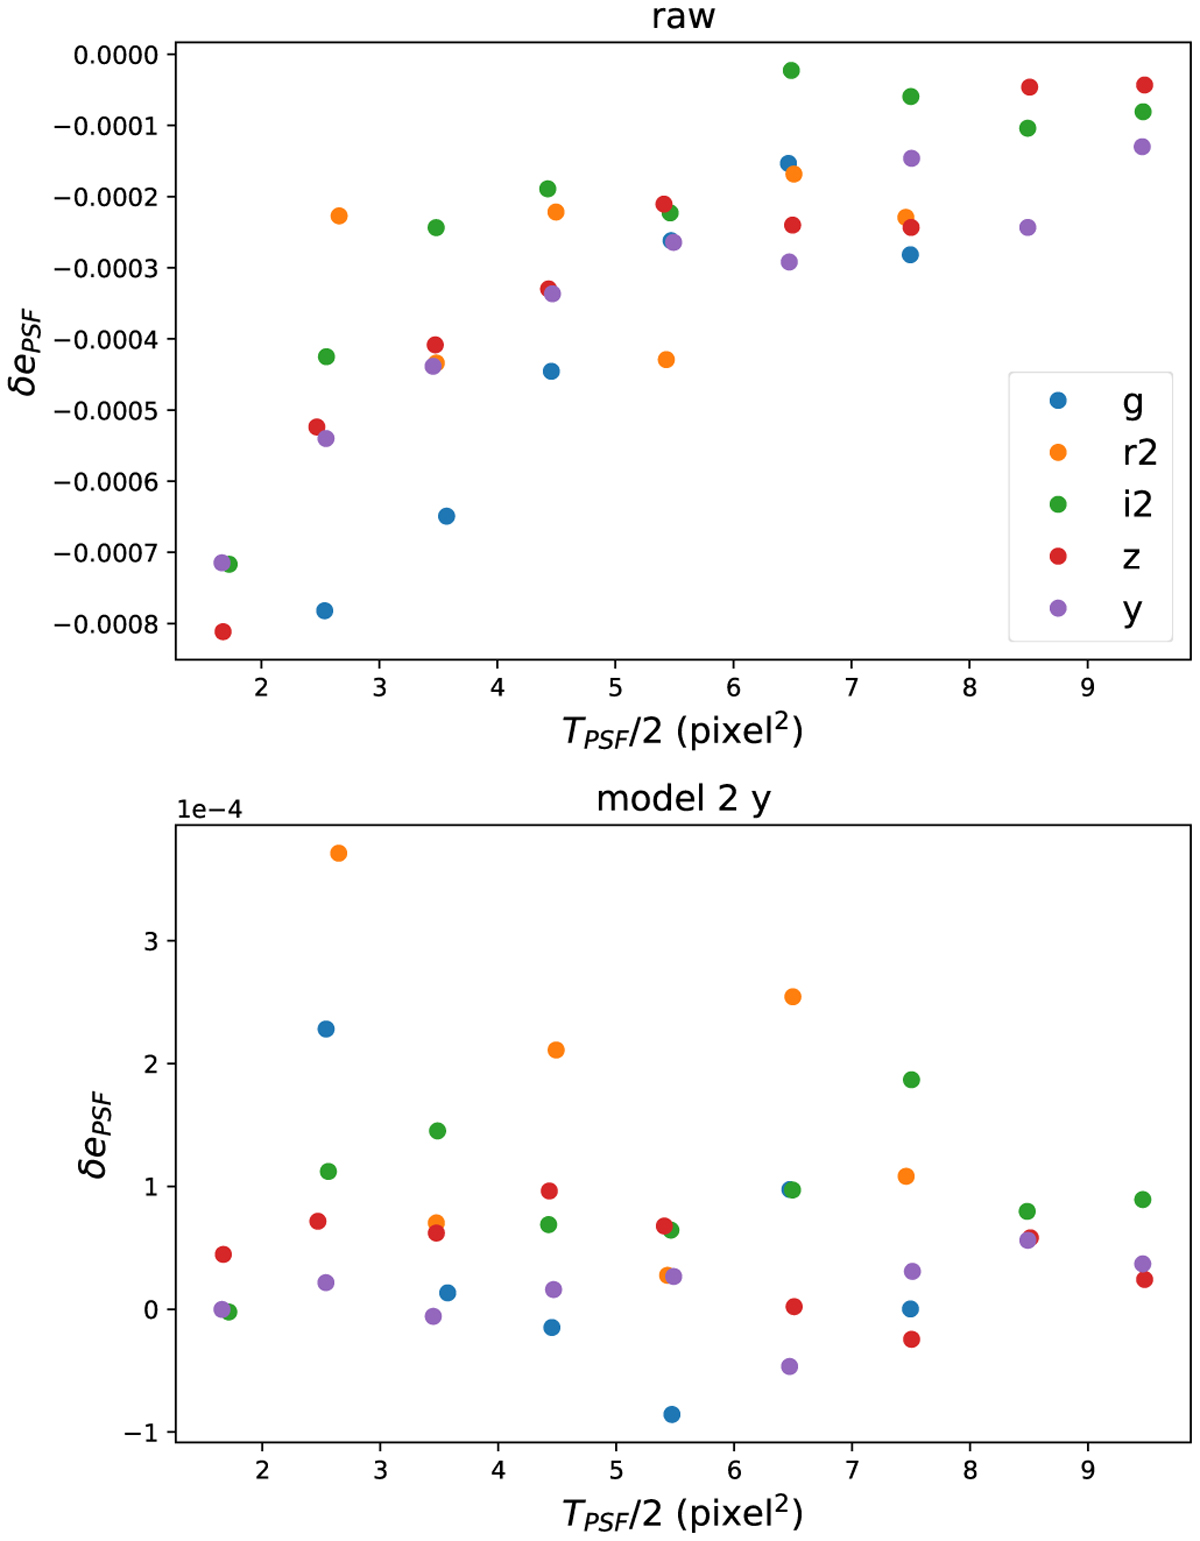
Change of the PSF ellipticity ePSF = (MXX − MYY)/TPSF between an average PSF star and a faint object, as a function of TPSF/2. The top plot refers to the raw data, the bottom one to the data corrected by model 2 with the shortened drift paths in y band. We assume that an average PSF star peaks at 1/3 of the saturation.
Current usage metrics show cumulative count of Article Views (full-text article views including HTML views, PDF and ePub downloads, according to the available data) and Abstracts Views on Vision4Press platform.
Data correspond to usage on the plateform after 2015. The current usage metrics is available 48-96 hours after online publication and is updated daily on week days.
Initial download of the metrics may take a while.