Fig. A.4.
Download original image
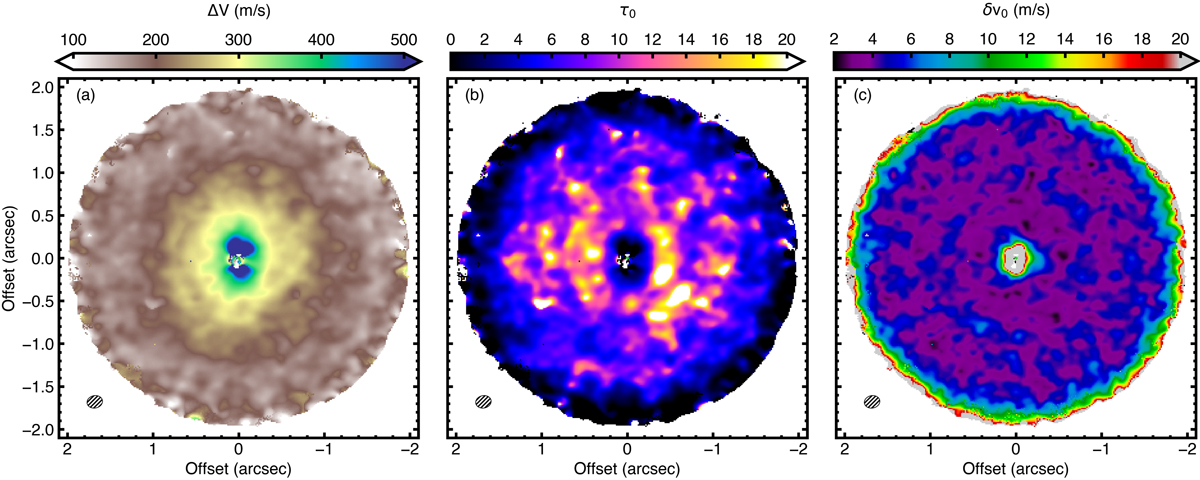
Additional moment maps of the centroid fitting. Panels show the line width, ΔV (left), the peak optical depth, τ0 (center), and the error of the centroid fitting, δv0 (right). Note that for τ0 < 1 one can assume the line profile to be well presented by a Gaussian, while for τ0 > 5 the line profile has a saturated core, i.e., a very flat top (see Eq. 2). The beam size is depicted in the lower-left corner, and only regions where I0 > 5σ with σ = 1.1 mJy beam−1 are shown.
Current usage metrics show cumulative count of Article Views (full-text article views including HTML views, PDF and ePub downloads, according to the available data) and Abstracts Views on Vision4Press platform.
Data correspond to usage on the plateform after 2015. The current usage metrics is available 48-96 hours after online publication and is updated daily on week days.
Initial download of the metrics may take a while.