Fig. A.2.
Download original image
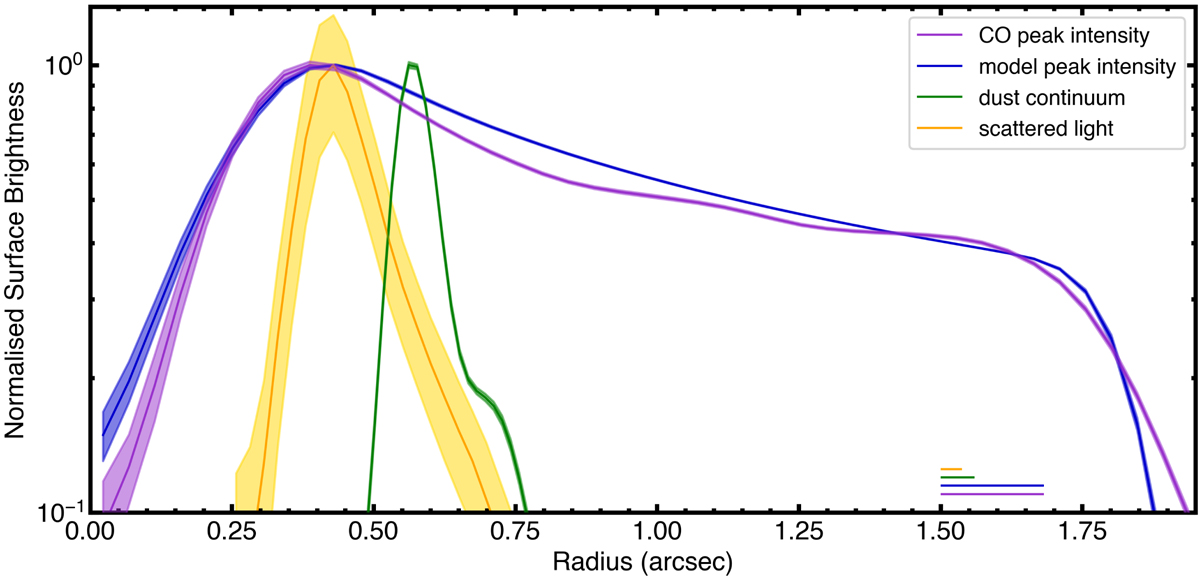
Radial profile of the surface brightness for different tracers. Profiles are normalized to the peak of the emission for the 231 GHz continuum and the CO peak flux (both for the data and discminer model) and for the SPHERE scattered-light observation. Shaded regions show the standard deviation of each azimuthal average. The lines in the lower-right corner show the major beam size (resolution) for each profile in the corresponding color.
Current usage metrics show cumulative count of Article Views (full-text article views including HTML views, PDF and ePub downloads, according to the available data) and Abstracts Views on Vision4Press platform.
Data correspond to usage on the plateform after 2015. The current usage metrics is available 48-96 hours after online publication and is updated daily on week days.
Initial download of the metrics may take a while.