Fig. A.1.
Download original image
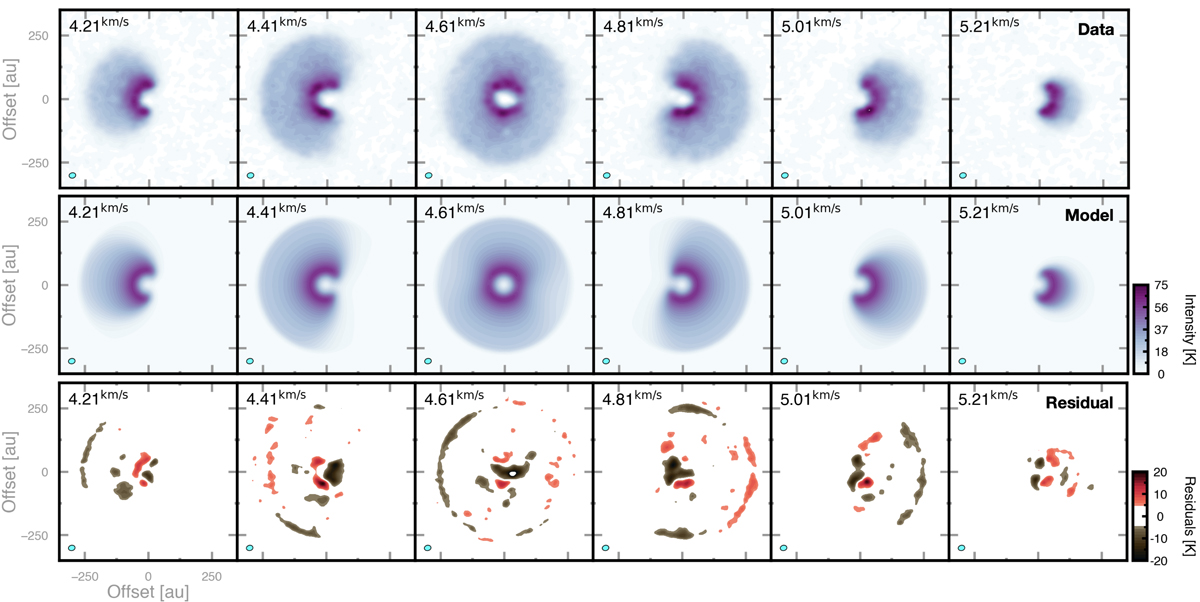
Gallery of selected channel maps. Panels show the 12CO data channel maps (top row) and best-fit model channel maps (middle row), together with intensity residuals in kelvins for each channel (bottom row). In the bottom row the colorbar has been adjusted such that residuals smaller than 1σ are white. The beam size is depicted in the lower-left corner of each channel. For reference, the best-fit systemic velocity was found to be vsys = 4.62 km s−1 and the channel spacing is 100 m s−1.
Current usage metrics show cumulative count of Article Views (full-text article views including HTML views, PDF and ePub downloads, according to the available data) and Abstracts Views on Vision4Press platform.
Data correspond to usage on the plateform after 2015. The current usage metrics is available 48-96 hours after online publication and is updated daily on week days.
Initial download of the metrics may take a while.