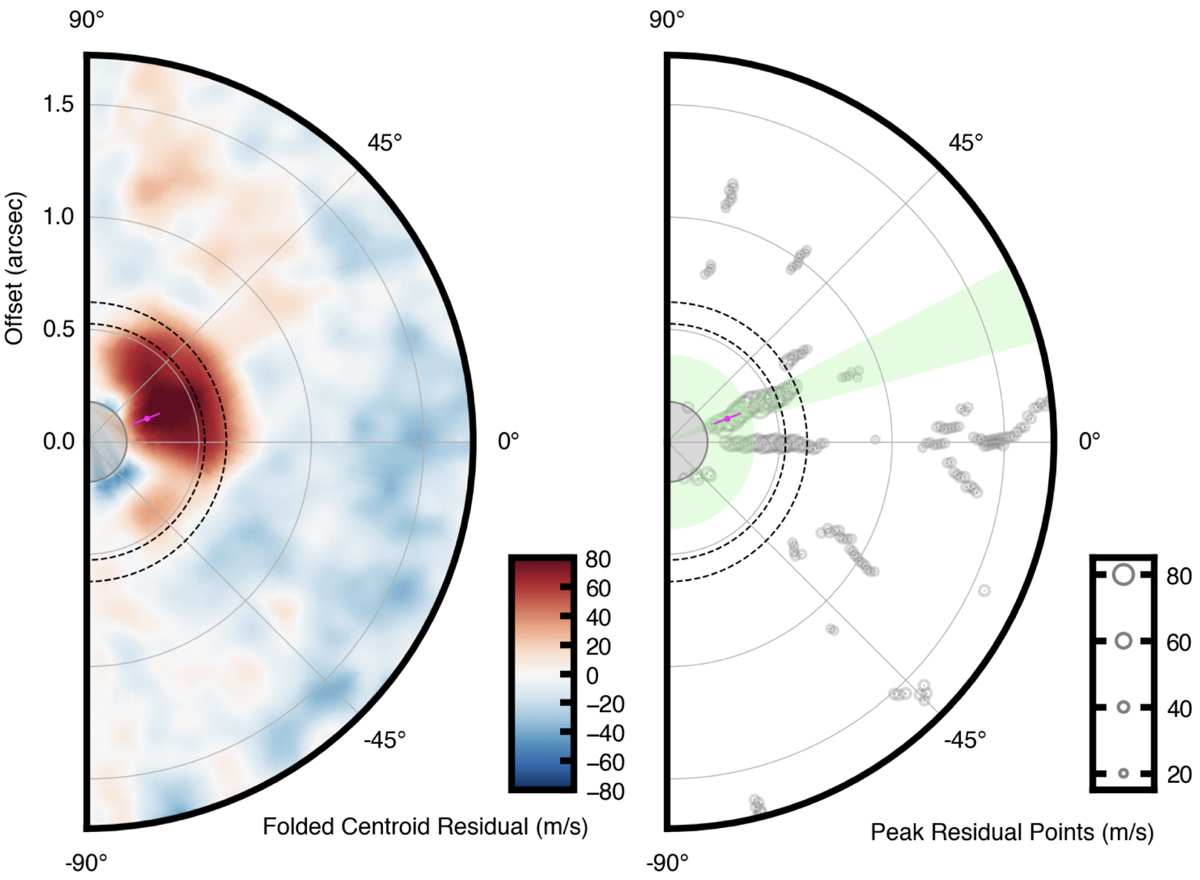
Fig. 3.

Download original image
Folded velocity residuals (left) and detected clusters of peak velocities (right) in the disk reference frame. The green shaded annulus and wedge in the right plot mark the significant clusters in radius and azimuth, respectively. The position of the localized velocity perturbation inferred from these clusters is marked with a magenta point with error bars. The gray region (one beam size in radius) indicates the masked area, and the black dashed lines the FWHM of the dust ring.
Current usage metrics show cumulative count of Article Views (full-text article views including HTML views, PDF and ePub downloads, according to the available data) and Abstracts Views on Vision4Press platform.
Data correspond to usage on the plateform after 2015. The current usage metrics is available 48-96 hours after online publication and is updated daily on week days.
Initial download of the metrics may take a while.


