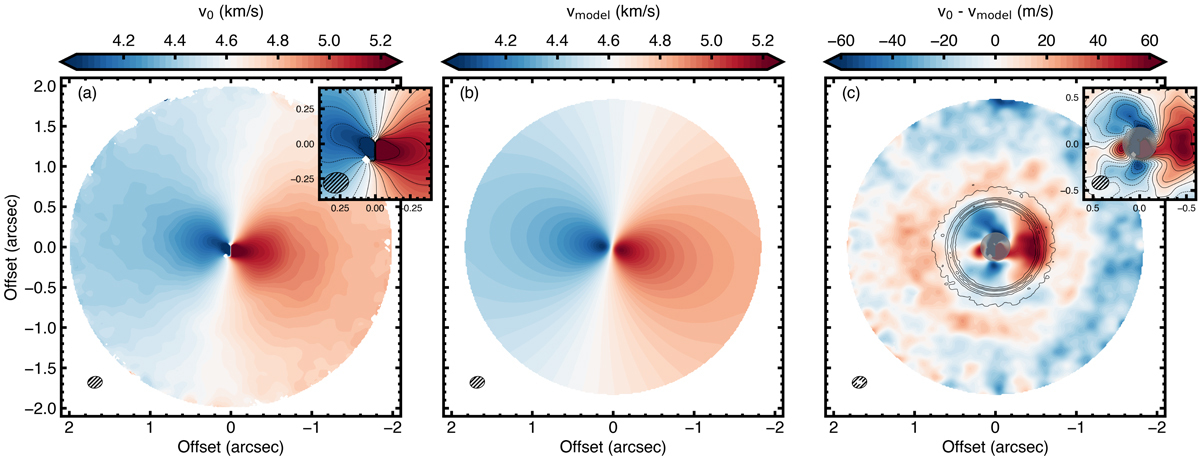
Fig. 2.
Download original image
Line-of-sight velocity maps for v0 data (a) and the discminer model, vmod (b). Panel c: velocity residual map after subtracting vmod from v0. The dust continuum is overlaid in solid contours with equal levels, as in Fig. 1. The innermost region was masked during the fit by one beam size in radius, shown as the gray shaded ellipse. The insets in panels a and c zoom into the innermost region of the disk to highlight the non-Keplerian velocities. Contours are drawn at vsys = (4.62 ± 0.60) km s−1 in steps of 0.1 km s−1 and from −60 to 60 m s−1 in steps of 10 m s−1, respectively. All maps show the synthesized beam for CO (black) and the continuum (white) in the lower-left corner. The beams are masked where the CO peak intensity falls below the 5σ level for panel a and where R > Rout for the rest.
Current usage metrics show cumulative count of Article Views (full-text article views including HTML views, PDF and ePub downloads, according to the available data) and Abstracts Views on Vision4Press platform.
Data correspond to usage on the plateform after 2015. The current usage metrics is available 48-96 hours after online publication and is updated daily on week days.
Initial download of the metrics may take a while.