Fig. B.1.
Download original image
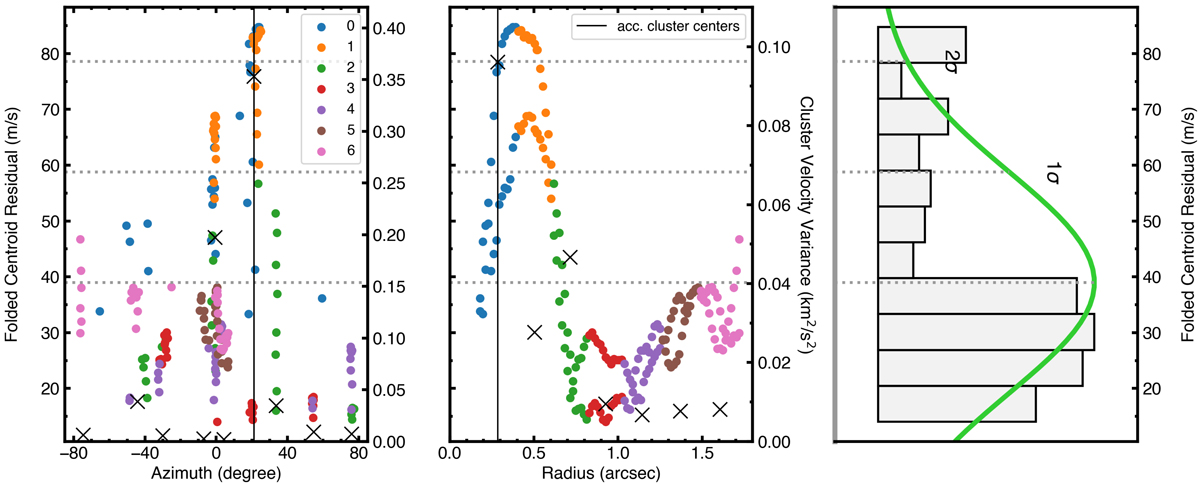
Location of the folded peak velocity residuals. The detected points are shown in azimuth (left) and radius (middle) and were obtained using the peak variance method. Colors indicate the seven different radial clusters specified, where blue peak residual points are within a detected significant radial cluster. The black crosses are the velocity variances of the clusters plotted at the (R, ϕ) location of each cluster center. The centers of the accepted clusters (those with peak velocity residuals larger than three times the variance in other clusters) in radius and azimuth are marked with vertical black lines in both panels. The right-hand plot shows the normal distribution of the peak residual points in a histogram. Note that outliers of the distribution are related to the localized perturbation. The maximum value of all peak folded centroid residuals is at 0.39″ (57 au), its mean value is 39 m/s, and 1σv = 20 m/s (not to be mistaken with the cluster variances).
Current usage metrics show cumulative count of Article Views (full-text article views including HTML views, PDF and ePub downloads, according to the available data) and Abstracts Views on Vision4Press platform.
Data correspond to usage on the plateform after 2015. The current usage metrics is available 48-96 hours after online publication and is updated daily on week days.
Initial download of the metrics may take a while.