Fig. A.6.
Download original image
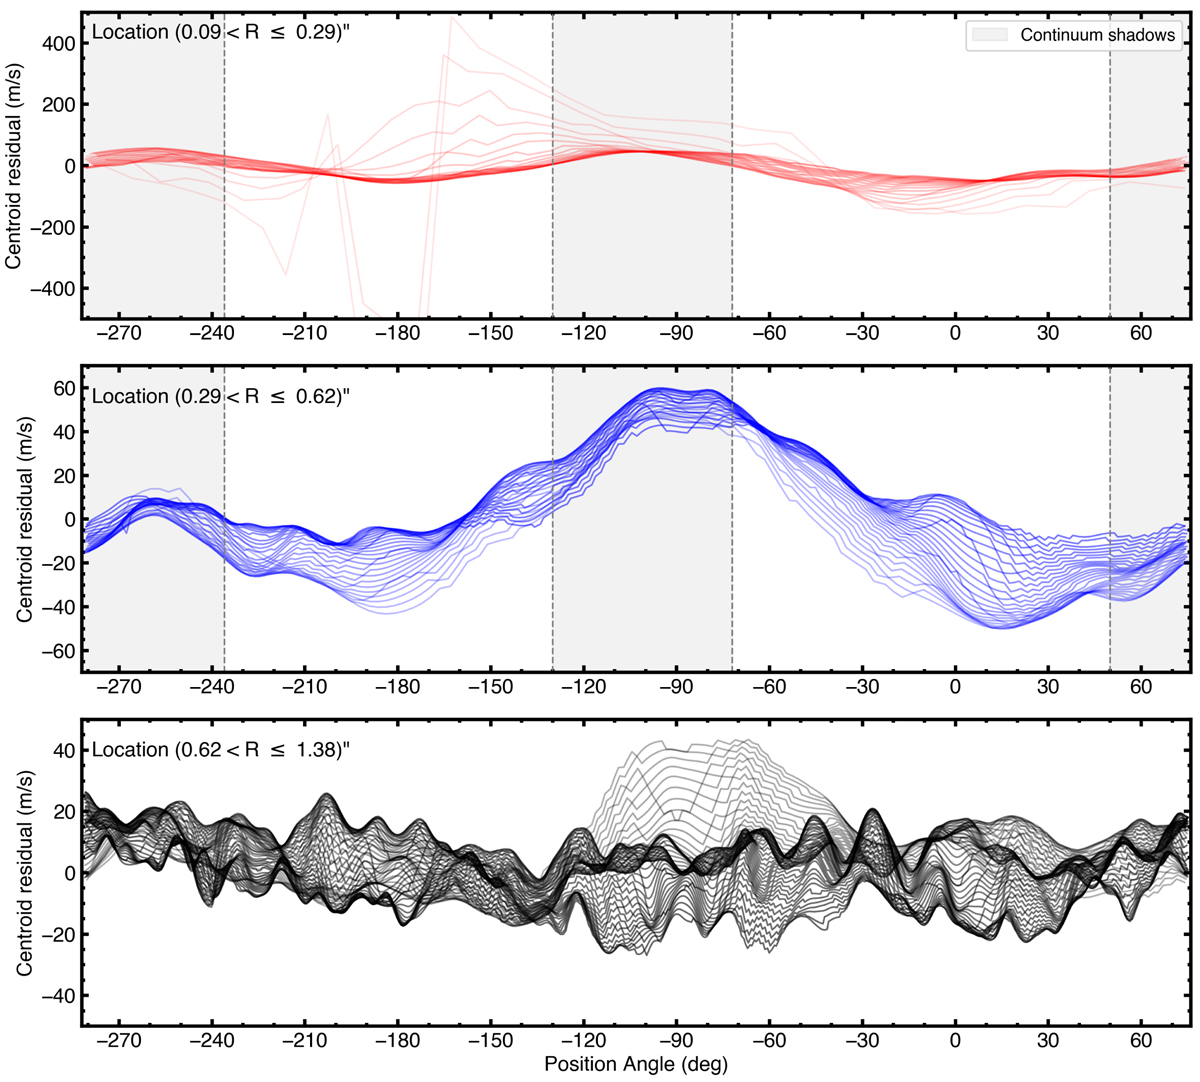
Polar contour map of the centroid residuals. The upper panel shows residuals inside the cavity, the middle panel residuals between the cavity and the outer edge of dust ring, and the lower panel the residuals in the outer disk. The radial spacing between each contour is ∼1.8 au, and the opacity of the lines increases with radius. We would like to emphasize that the bump between PA≈ − (110 − 70)° in the middle panel includes most of the residual points we detect with the peak variance method of discminer, which can be readily seen in the left panel of Fig. B.1.
Current usage metrics show cumulative count of Article Views (full-text article views including HTML views, PDF and ePub downloads, according to the available data) and Abstracts Views on Vision4Press platform.
Data correspond to usage on the plateform after 2015. The current usage metrics is available 48-96 hours after online publication and is updated daily on week days.
Initial download of the metrics may take a while.