Fig. 1.
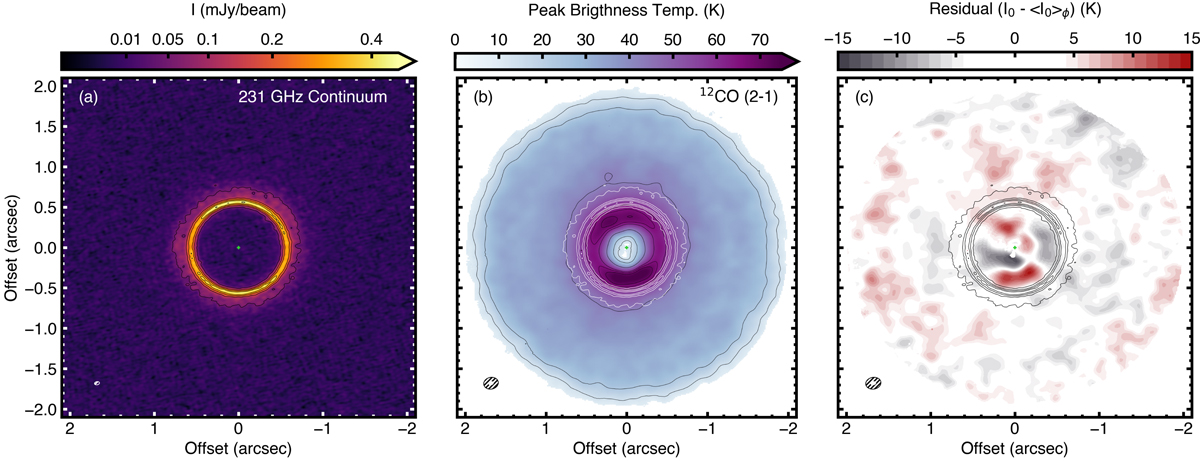
Download original image
ALMA observations of J1604. Panel a: 231 GHz dust continuum. The solid black contours are drawn at [5, 15, 25, 35, 45]σ, and the image is plotted with a power-law scaling of γ = 0.6. Panel b: 12CO peak brightness temperature map computed from I0 using the Planck law with black solid contours drawn at [5, 10, 20, 40, 60, 65, 70] σ. Pixels below 5σ are masked. Panel c: peak intensity residuals after subtracting an azimuthally averaged radial profile from the data. We have adjusted the color scale such that residuals smaller than 1σ are white. The beam sizes are shown in the lower-left corner, and the position of the star is marked by a green cross. In panels b and c, we have overlaid the continuum contours in white and black, respectively.
Current usage metrics show cumulative count of Article Views (full-text article views including HTML views, PDF and ePub downloads, according to the available data) and Abstracts Views on Vision4Press platform.
Data correspond to usage on the plateform after 2015. The current usage metrics is available 48-96 hours after online publication and is updated daily on week days.
Initial download of the metrics may take a while.