Fig. 5
Download original image
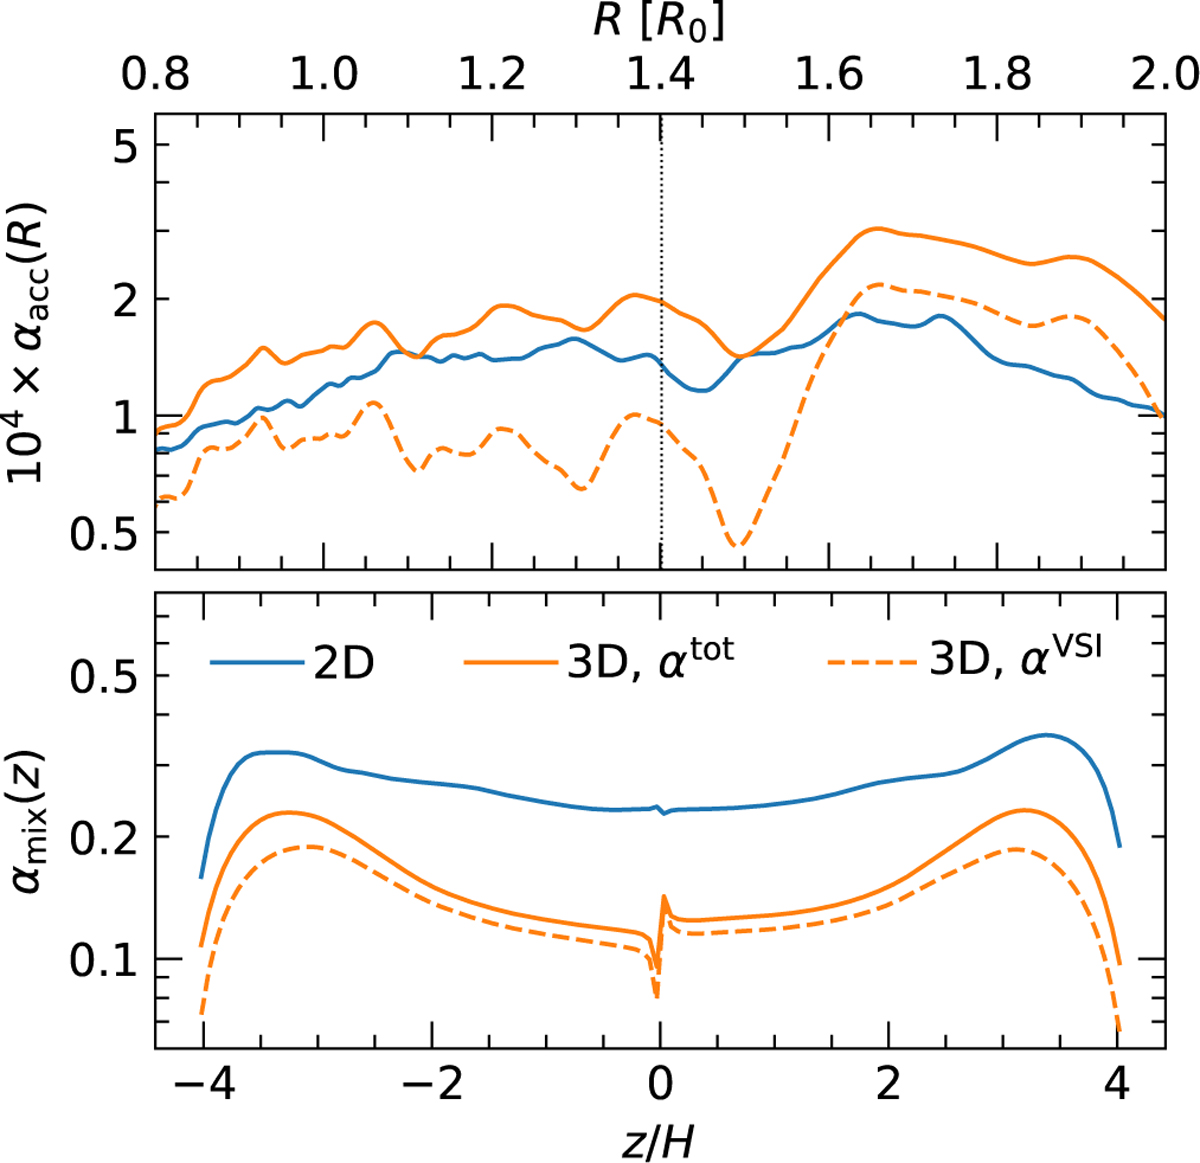
Turbulent parameters αacc and αmix in our fiducial 3D model. Our 2D results from Fig. 3 are shown in blue curves. The total stress in the disk is shown with solid curves, while dashed curves isolate the contribution of the VSI. While ![]() increases slightly, decreases such that
increases slightly, decreases such that ![]() . This happens due to the stronger accretion stress supplied by spiral arms that in fact weaken the VSI, which is the primary driver of vertical motion. The bottom panel is calculated at the radial location shown by the vertical line in the top panel (here, R = 1.4R0).
. This happens due to the stronger accretion stress supplied by spiral arms that in fact weaken the VSI, which is the primary driver of vertical motion. The bottom panel is calculated at the radial location shown by the vertical line in the top panel (here, R = 1.4R0).
Current usage metrics show cumulative count of Article Views (full-text article views including HTML views, PDF and ePub downloads, according to the available data) and Abstracts Views on Vision4Press platform.
Data correspond to usage on the plateform after 2015. The current usage metrics is available 48-96 hours after online publication and is updated daily on week days.
Initial download of the metrics may take a while.