Fig. 4
Download original image
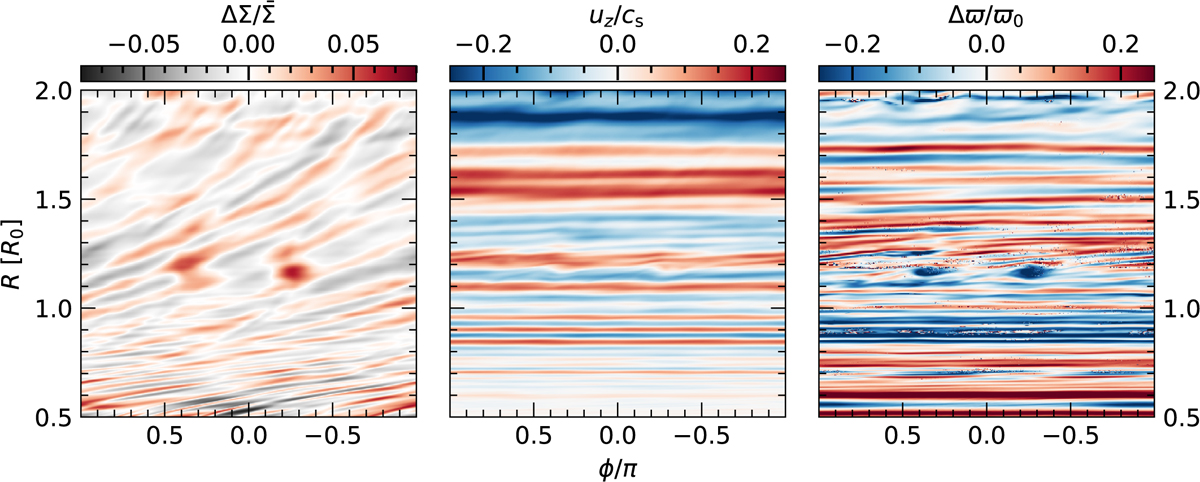
Highlights of our 3D fiducial model. Left: surface density deviations in the disk compared to the azimuthally averaged surface density ![]() , showing azimuthal structure in the form of spirals and vortices. Middle: vertical velocity of the gas at the disk midplane; quasi-axisymmetric stripes reveal VSI activity. Right: a map of the gas vortensity deviations compared to the initial (Keplerian) vortensity ϖ0, highlighting two vortices orbiting at R ≈ 1.15 R0
, showing azimuthal structure in the form of spirals and vortices. Middle: vertical velocity of the gas at the disk midplane; quasi-axisymmetric stripes reveal VSI activity. Right: a map of the gas vortensity deviations compared to the initial (Keplerian) vortensity ϖ0, highlighting two vortices orbiting at R ≈ 1.15 R0
Current usage metrics show cumulative count of Article Views (full-text article views including HTML views, PDF and ePub downloads, according to the available data) and Abstracts Views on Vision4Press platform.
Data correspond to usage on the plateform after 2015. The current usage metrics is available 48-96 hours after online publication and is updated daily on week days.
Initial download of the metrics may take a while.