Open Access
Fig. B.1
Download original image
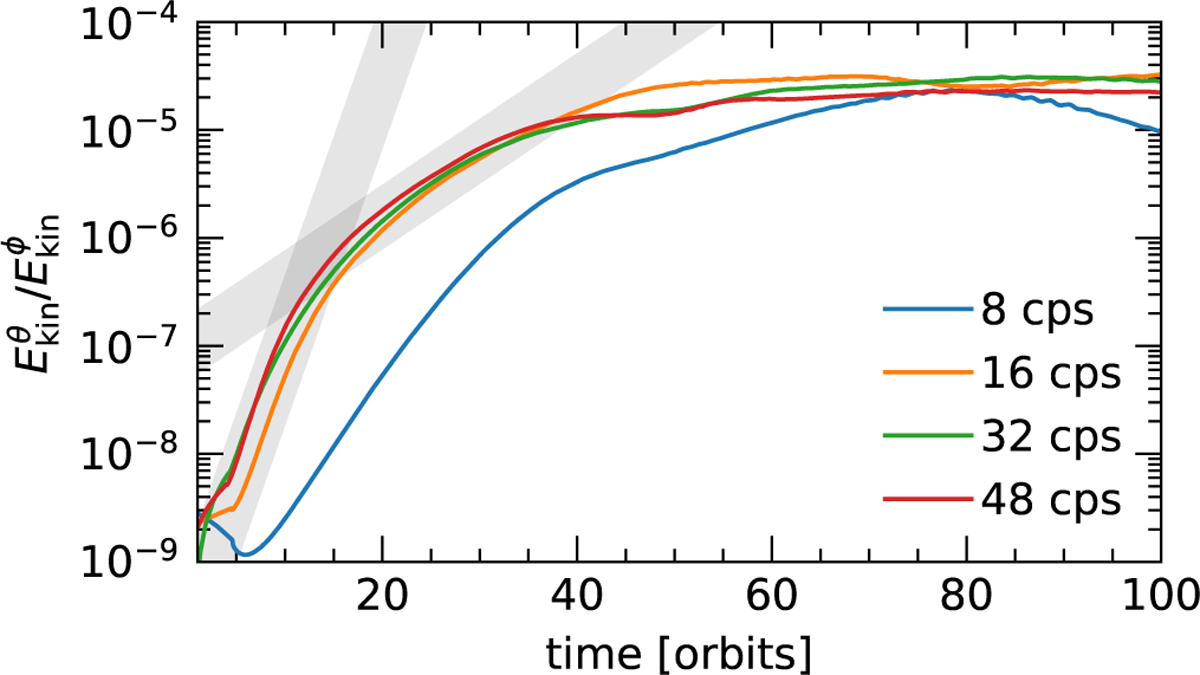
Growth rates of the VSI as a function of resolution in cells per scale height (cps) in our axisymmetric models. The two shaded bands denote a growth rate of 0.58/orbit and 0.13/orbit for the steep and shallow bands respectively, in agreement with Stoll & Kley (2014).
Current usage metrics show cumulative count of Article Views (full-text article views including HTML views, PDF and ePub downloads, according to the available data) and Abstracts Views on Vision4Press platform.
Data correspond to usage on the plateform after 2015. The current usage metrics is available 48-96 hours after online publication and is updated daily on week days.
Initial download of the metrics may take a while.