Fig. 3.
Download original image
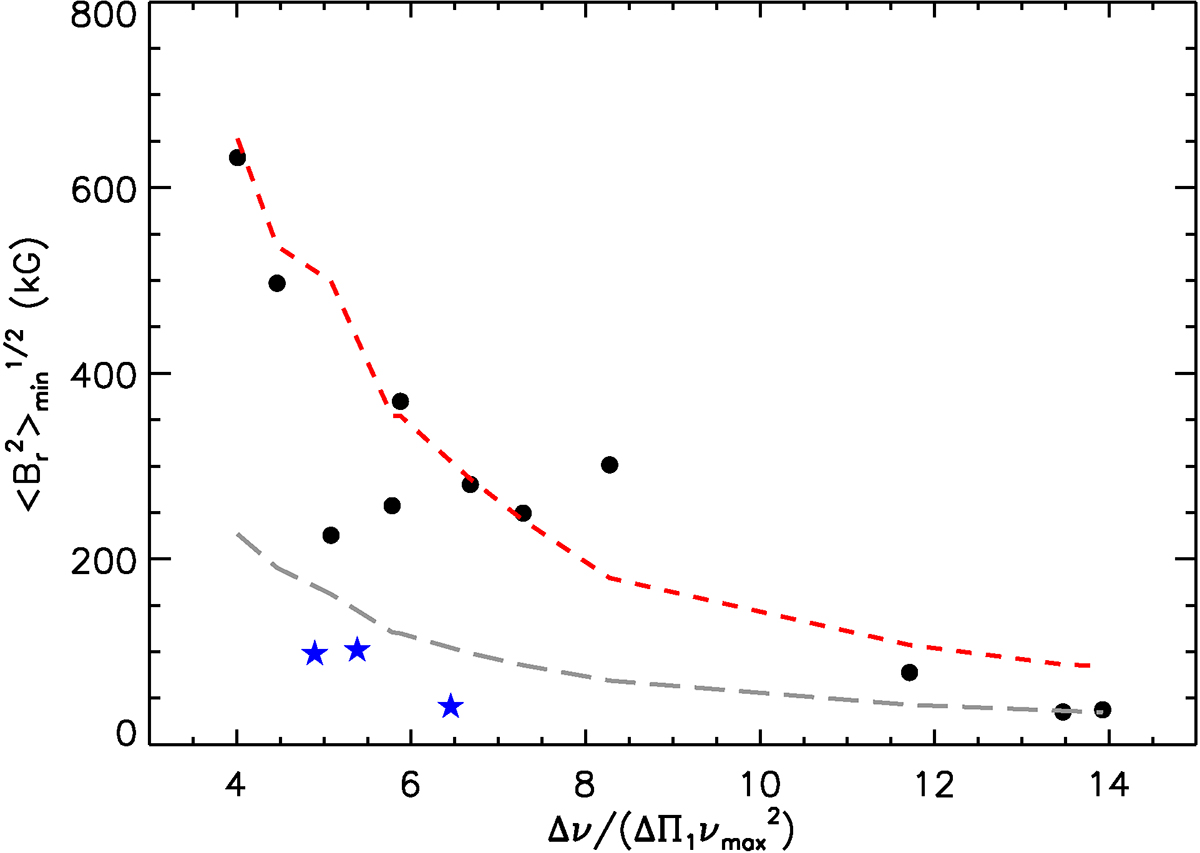
Minimal field strength ![]() required to account for the observed distortions in the g-mode period spacing for the 11 stars of our sample (black circles). They are plotted as a function of the mixed mode density
required to account for the observed distortions in the g-mode period spacing for the 11 stars of our sample (black circles). They are plotted as a function of the mixed mode density ![]() , which is a proxy for evolution along the RGB (Gehan et al. 2018). The red dashed line indicates the critical field Bc and the gray long-dashed line shows the minimal field strength Bth required to detect the distortions in the g-mode pattern. The blue star symbols show the stars from Li et al. (2022).
, which is a proxy for evolution along the RGB (Gehan et al. 2018). The red dashed line indicates the critical field Bc and the gray long-dashed line shows the minimal field strength Bth required to detect the distortions in the g-mode pattern. The blue star symbols show the stars from Li et al. (2022).
Current usage metrics show cumulative count of Article Views (full-text article views including HTML views, PDF and ePub downloads, according to the available data) and Abstracts Views on Vision4Press platform.
Data correspond to usage on the plateform after 2015. The current usage metrics is available 48-96 hours after online publication and is updated daily on week days.
Initial download of the metrics may take a while.