Fig. 9
Download original image
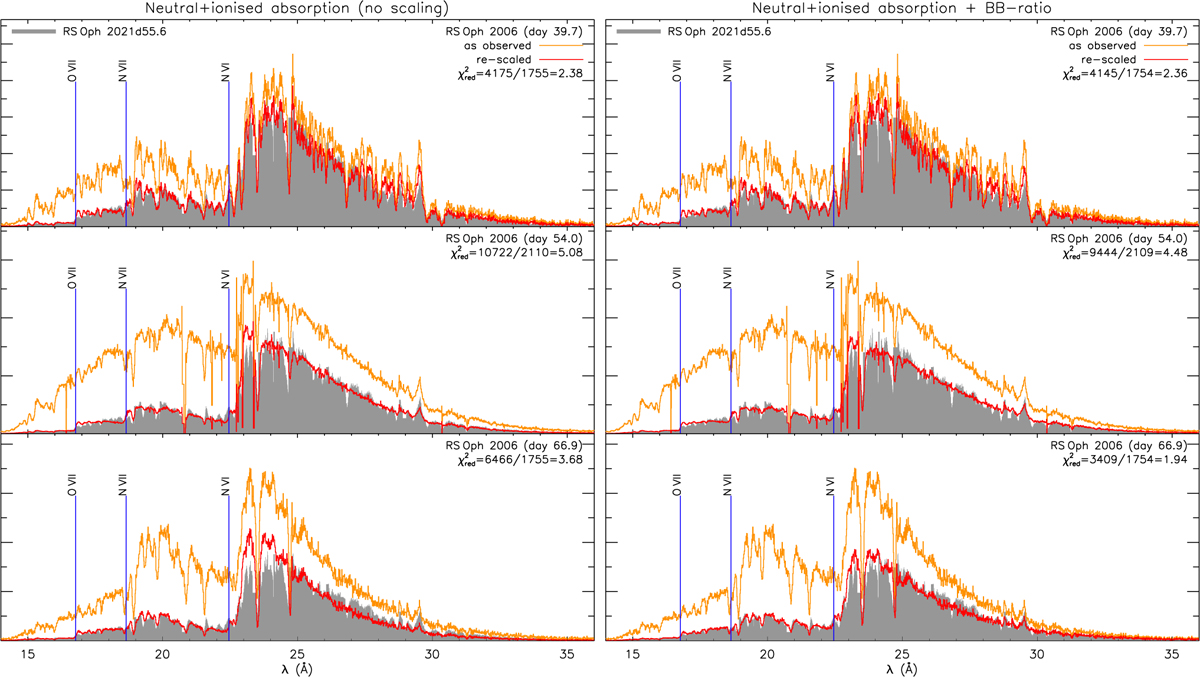
XMM-Newton RGS1 spectrum obtained on 2021d55.6 (grey shadings) compared to the 2006 spectra obtained on 2006d39.7 (top), 2006d54 (middle), and 2006d66.9 (bottom). The orange lines represent the unscaled (brighter) 2006 spectra as observed, while the respective red lines are the results of applying an absorption model to the observed 2006 spectra assuming the absorption parameters given in Table 2: ΔNH of an absorption model of only neutral absorbers with modification of the depth of the O I absorption edge at 22.8 Å and the parameters of three absorption edges of highly ionised ions with values of optical depths and column density. A scaling factor was not applied. In the left panel, the result from scaling only with an absorption model is shown, while in the right panel, additional scaling with blackbody ratio has been applied, thus assuming a change in temperature between the spectra. The parameters of these and more models are given in Table 2.
Current usage metrics show cumulative count of Article Views (full-text article views including HTML views, PDF and ePub downloads, according to the available data) and Abstracts Views on Vision4Press platform.
Data correspond to usage on the plateform after 2015. The current usage metrics is available 48-96 hours after online publication and is updated daily on week days.
Initial download of the metrics may take a while.