Fig. 8
Download original image
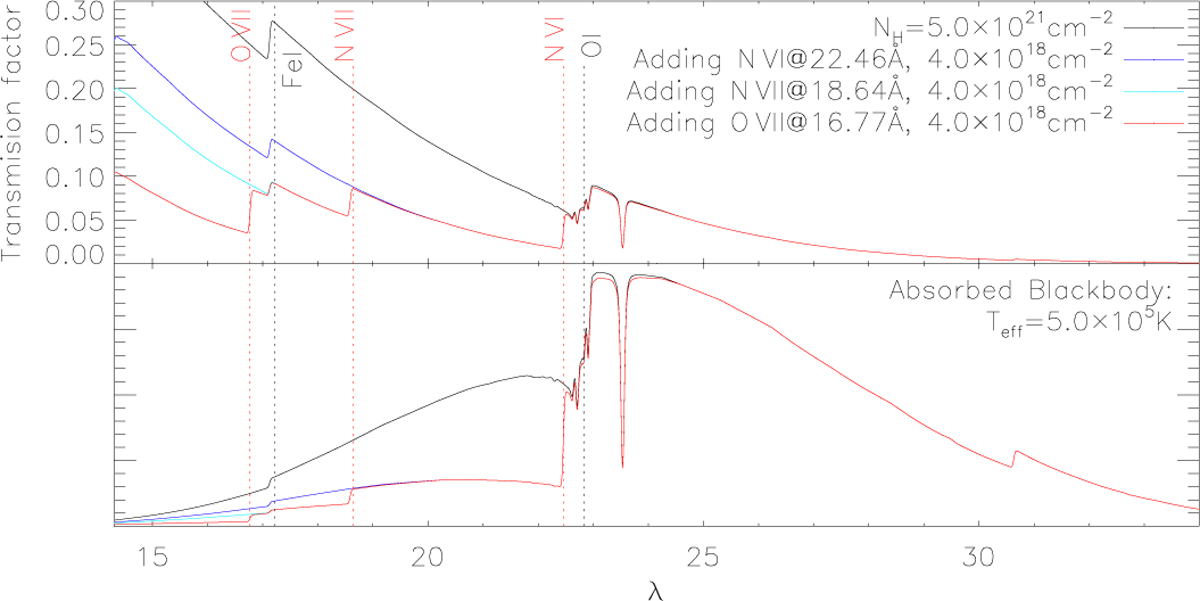
Illustration of how to down-scale an observed source spectrum, assuming higher absorption. In the top panel, transmission curves are shown assuming an arbitrary value of neutral hydrogen column density NH and cosmic abundances of other elements. Different colours represent a pure (neutral) interstellar absorption model (black) and modifications when successively adding (hot) absorption edges at the respective ionisation energies of O VII, N VII, and N VI (see labels); thus, the red curve represents the absorption model accounting for all edges. In the bottom panel, the effect of absorption is illustrated for the example of a blackbody source with an effective temperature of 500,000K. These absorption models were designed to be applied to emission models but can also be applied to data of sufficiently high spectral resolution; see Sect. 3.2.3 for details.
Current usage metrics show cumulative count of Article Views (full-text article views including HTML views, PDF and ePub downloads, according to the available data) and Abstracts Views on Vision4Press platform.
Data correspond to usage on the plateform after 2015. The current usage metrics is available 48-96 hours after online publication and is updated daily on week days.
Initial download of the metrics may take a while.