Fig. 7
Download original image
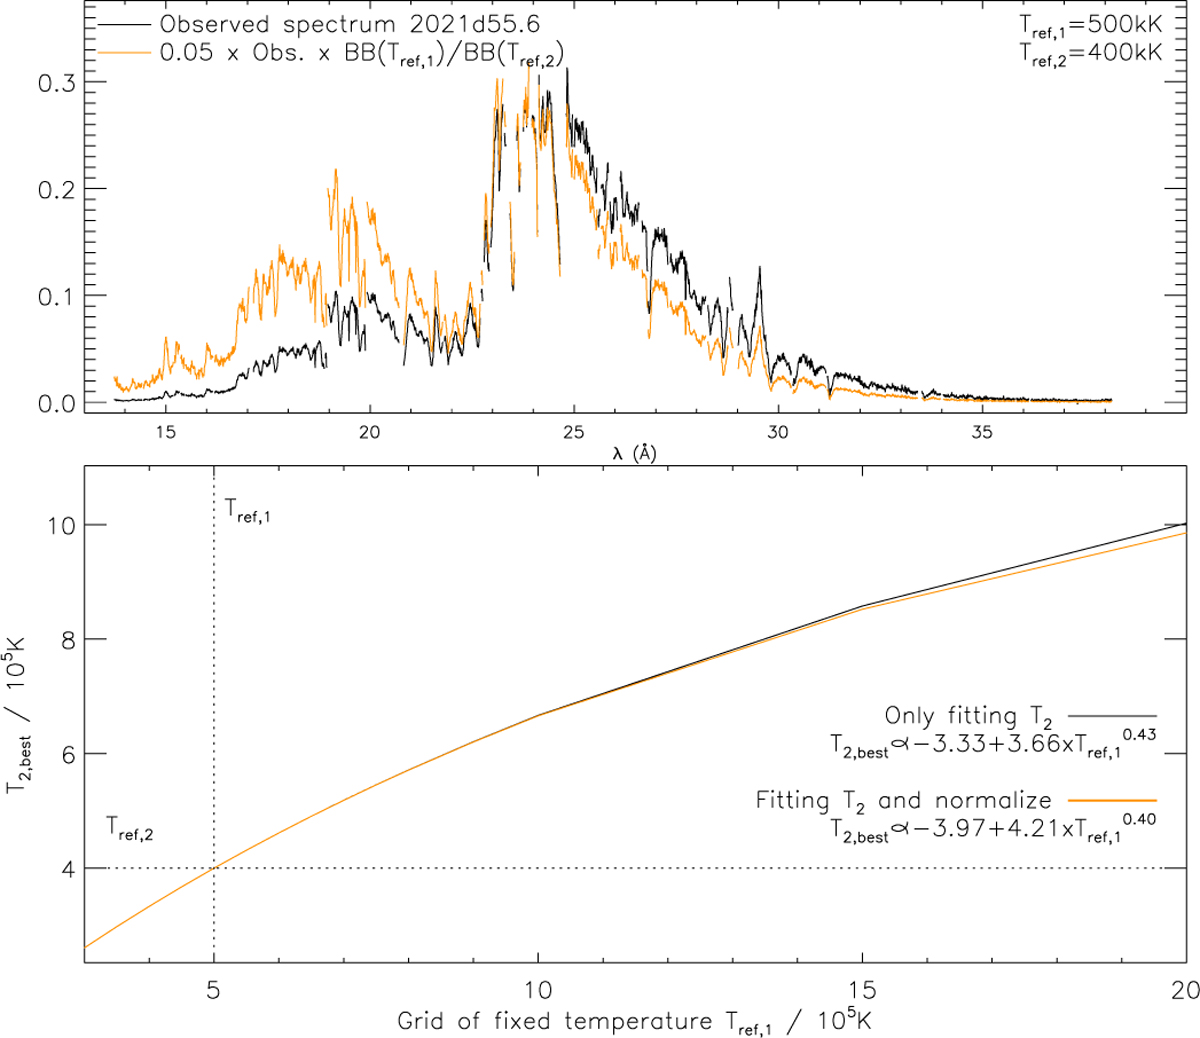
Illustration of the scaling method with the ratio of two different blackbody curves and that many pairs of Tref,1 and Tref,2 can produce the same blackbody ratio curve. In the top panel, the RGS1 spectrum of RS Oph from 2021d55.6 (black) is multiplied with the ratio of two blackbody models corresponding to Tref,1 = 5 × 10⁵ K (=500 kK) and Tref,2 = 4 × 10⁵ K (=400 kK), respectively and normalised (see legend). The resulting spectrum (orange) is a factor 20 brighter but is also harder. The bottom panel shows the results of fitting only Tref,2 with (black) and without (orange) additional normalisation while Tref,1 is fixed at given grid values (x-axis) to reproduce the 500 kK/400 kK ratio curve. The bottom right legend provides empirical analytic relationships between fixed grid value and T2,best values reproducing the same ratio curve. The same relationships are found for any other pairs of reference temperatures Tref,1 and Tref,2; see Sect. 3.2.2 for details.
Current usage metrics show cumulative count of Article Views (full-text article views including HTML views, PDF and ePub downloads, according to the available data) and Abstracts Views on Vision4Press platform.
Data correspond to usage on the plateform after 2015. The current usage metrics is available 48-96 hours after online publication and is updated daily on week days.
Initial download of the metrics may take a while.