Fig. 2
Download original image
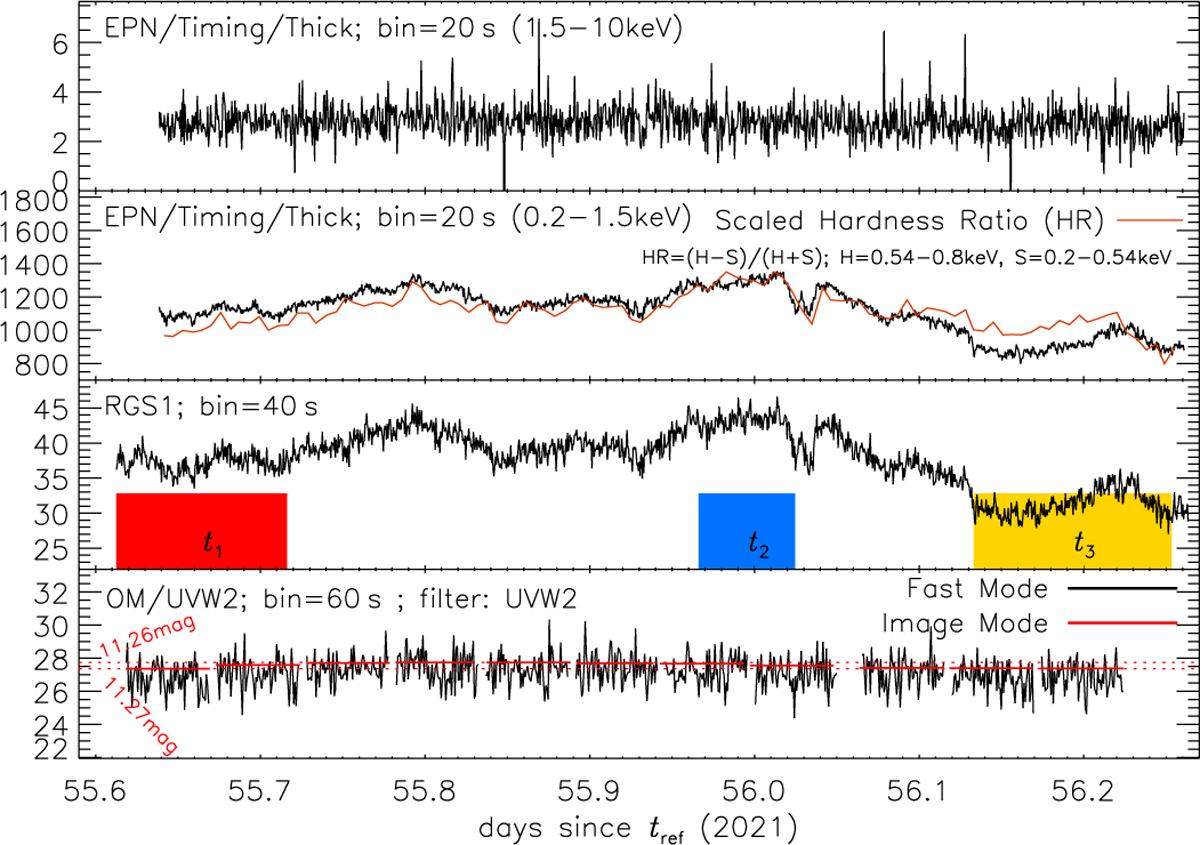
XMM-Newton X-ray and UV light curves (units counts per second, cps) extracted from the pn, RGS1, and OM instruments taken on day 2021d55.6 (see x-axis labels). The photon arrival times were converted to days after tref = 2021-08-09.5417. The pn light curve is broken into a hard (top) and a soft (second panel) band split at 1.5 keV (see legends for individual energy bands), probing shock and SSS emission, respectively. The soft band is split into two bands, H and S, with the split at 0.54keV, and the orange curve in the second panel represents the scaled hardness ratio (HR) constructed from countrates recorded in the energy bands H and S as given in the legend. The shaded coloured area in the third panel marks light-curve segments discussed separately in Sect. 3.3. In the bottom panel, the OM UVM2 filter (~2070–2170 Å range) light curves are shown from the Image mode (red horizontal bars for each exposure) and Fast mode (black) data. Count rates are plotted, and corresponding magnitude values are included on the left, which correspond to the lowest and highest Image mode count rates (marked with the dotted horizontal red lines).
Current usage metrics show cumulative count of Article Views (full-text article views including HTML views, PDF and ePub downloads, according to the available data) and Abstracts Views on Vision4Press platform.
Data correspond to usage on the plateform after 2015. The current usage metrics is available 48-96 hours after online publication and is updated daily on week days.
Initial download of the metrics may take a while.