Fig. A.2
Download original image
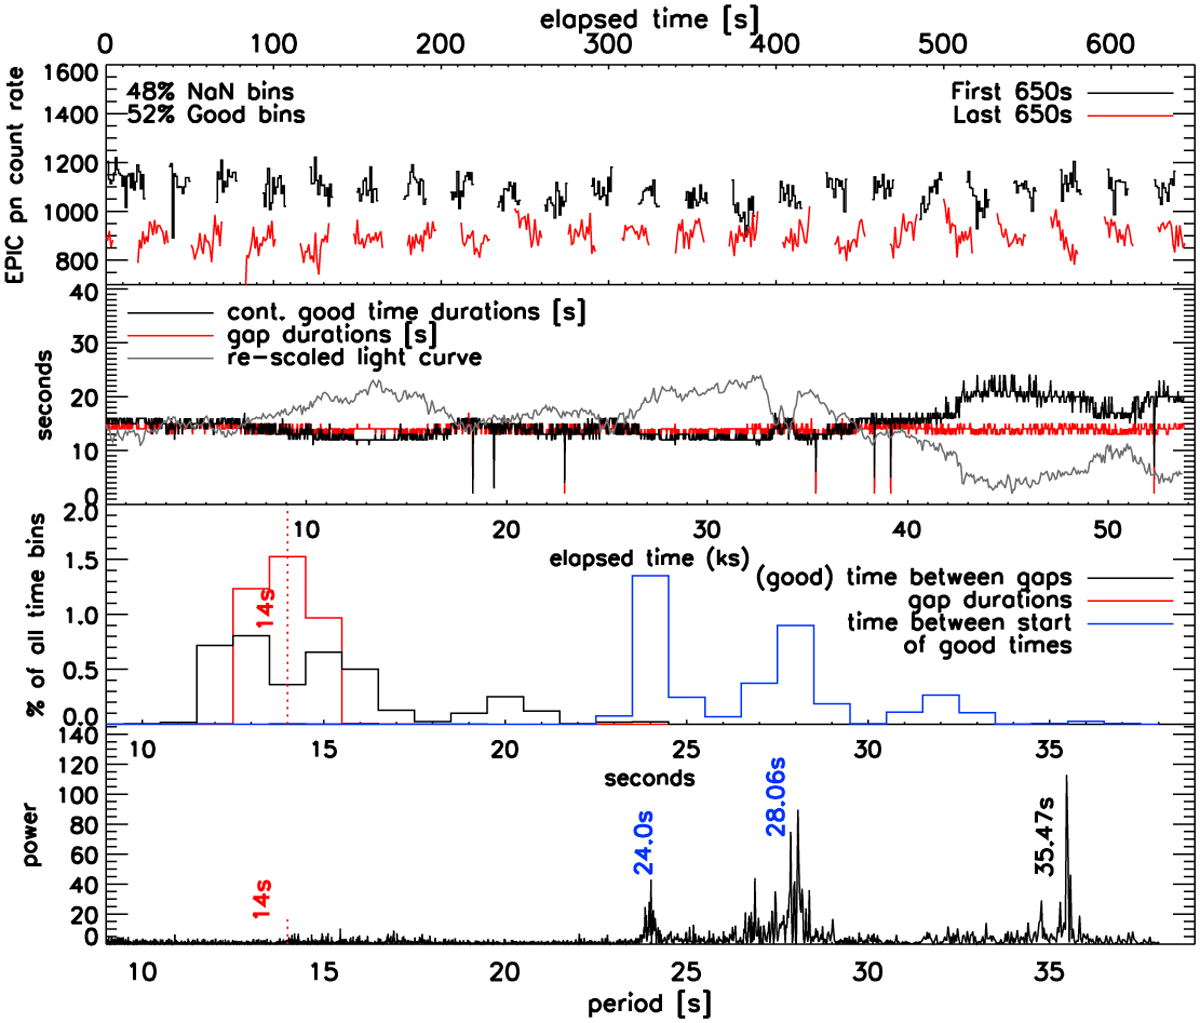
Illustration of telemetry losses in the soft (0.2–1.5 keV) pn light curve taken on day 2021d55.6. Top: First and last 600s time segments of the light curve showing regular gaps between time intervals taking data. During the last 600s segment, with a lower count rate, the duration of continuous good times are slightly longer, illustrating the dependence of losses with count rate. Second panel: time evolution of durations of continuous good time intervals (black) and gaps without data (red) in comparison to the (re-scaled) count rates (grey). The durations of continuous data-taking were longer while the source was fainter. Third panel: Histogram distributions of durations of goodtimes (black), gaps (red), and times between starting good-time intervals (blue). The durations of gaps vary within very small margins, independent of count rate, between 13 – 15 s while the durations of good times vary between ~10 – 20 s (dependent on count rate, see panel above). The distribution of times between start times of data-taking intervals cluster at 24s and 28s, and these peaks introduce an alias to period studies as seen in the bottom panel where the periodogram contains peaks at these periods.
Current usage metrics show cumulative count of Article Views (full-text article views including HTML views, PDF and ePub downloads, according to the available data) and Abstracts Views on Vision4Press platform.
Data correspond to usage on the plateform after 2015. The current usage metrics is available 48-96 hours after online publication and is updated daily on week days.
Initial download of the metrics may take a while.