Fig. 13
Download original image
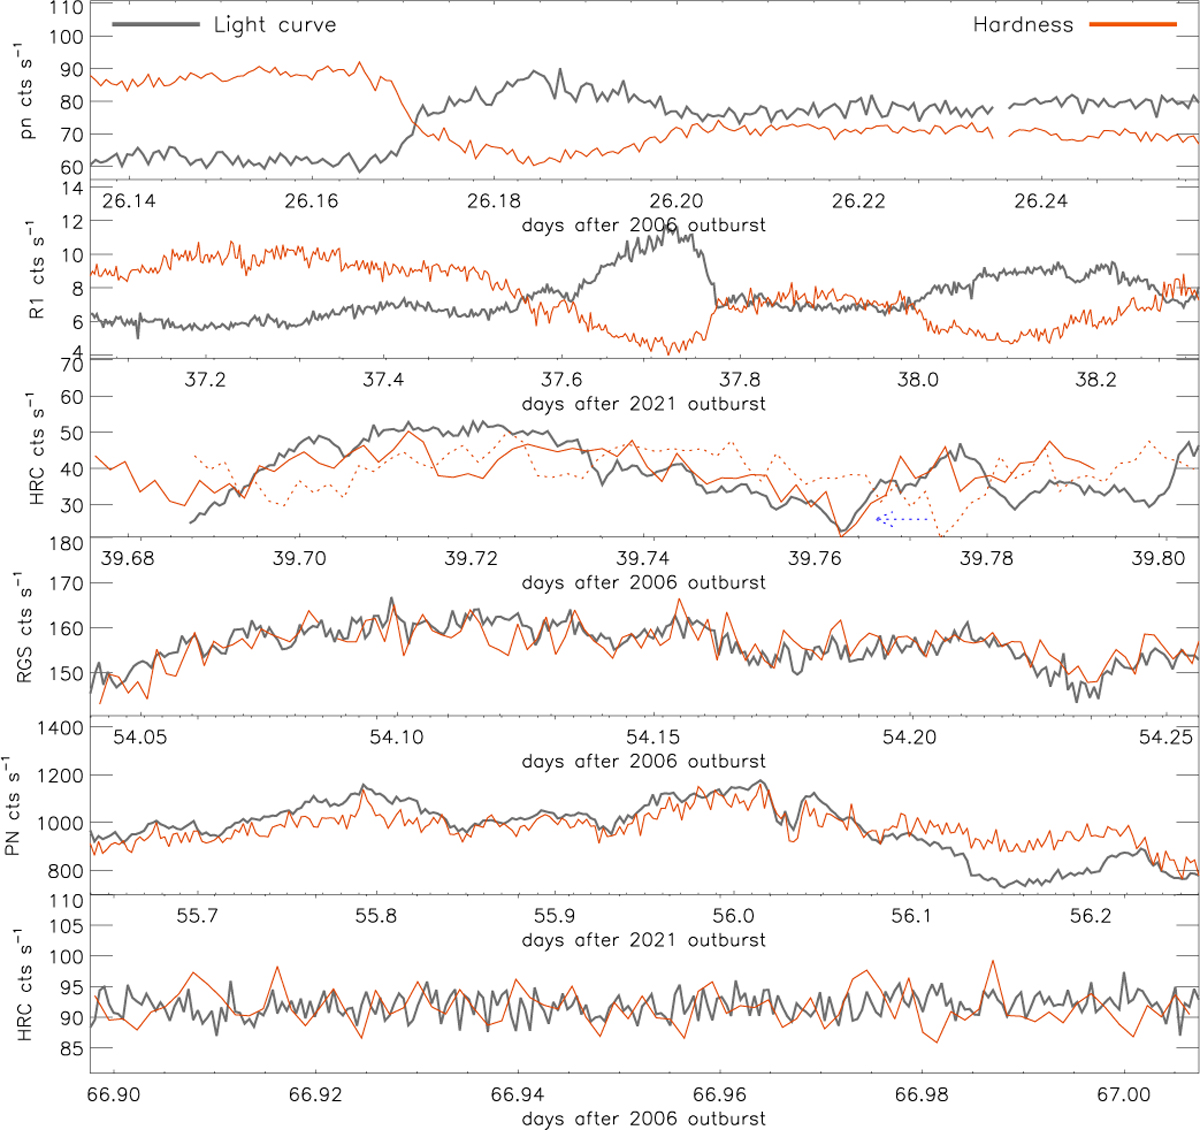
Comparisons of 2006 and 2021 light curves with the respective hardness-ratio light curves (see respective horizontal axes labels). In the third panel (2006d39.7), the observed hardness ratio light curve is shown with a dotted line while the solid line represents the hardness ratio light curve shifted by −1000 s (see Ness et al. 2007; Schönrich & Ness 2008; Ness 2015). No such lag is seen on days 2006d54 and 2021d55.6, although a small lag might be present. On days 2006d26.1 and 2021d37.1 (top two panels), hardness and brightness are anti-correlated, reflecting the appearance and disappearance of the complex soft emission component, while much less variability is seen during the decline observed on day 2006d66.9 (bottom panel).
Current usage metrics show cumulative count of Article Views (full-text article views including HTML views, PDF and ePub downloads, according to the available data) and Abstracts Views on Vision4Press platform.
Data correspond to usage on the plateform after 2015. The current usage metrics is available 48-96 hours after online publication and is updated daily on week days.
Initial download of the metrics may take a while.