Fig. 11
Download original image
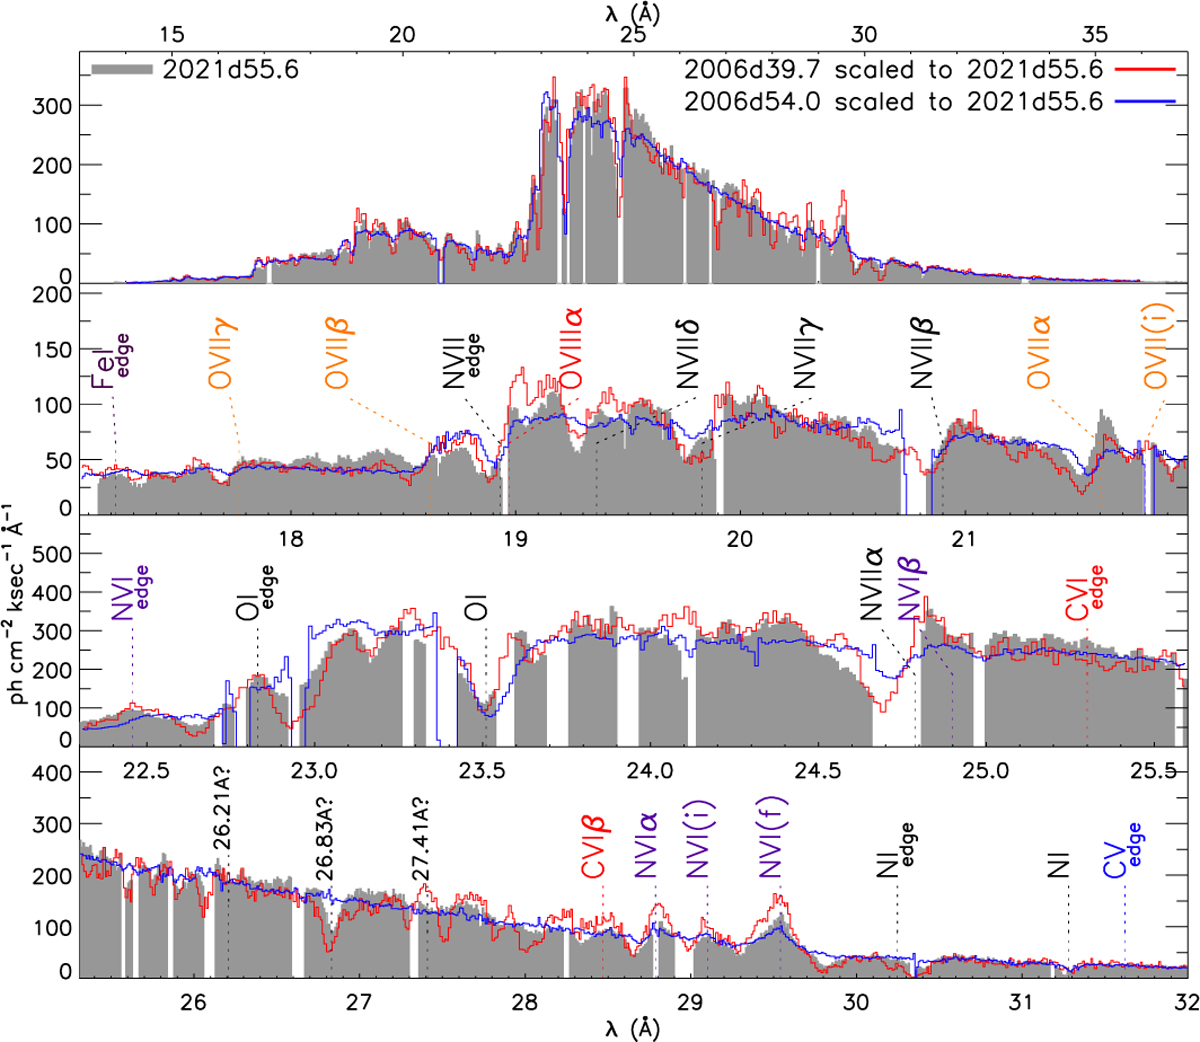
XMM-Newton RGS1 spectrum taken on 2021d55.6 compared to 2006 spectra scaled with the pure absorption model (left column in Fig. 9). The lower panels show details, and although the 2021d55.6 spectrum has a lot of gaps, one can see that the same-epoch 2006 spectrum (blue) contains much weaker absorption lines, while on the sub-Å level, there is a greater resemblance to the 2006d39.7 spectrum.
Current usage metrics show cumulative count of Article Views (full-text article views including HTML views, PDF and ePub downloads, according to the available data) and Abstracts Views on Vision4Press platform.
Data correspond to usage on the plateform after 2015. The current usage metrics is available 48-96 hours after online publication and is updated daily on week days.
Initial download of the metrics may take a while.