Fig. 1
Download original image
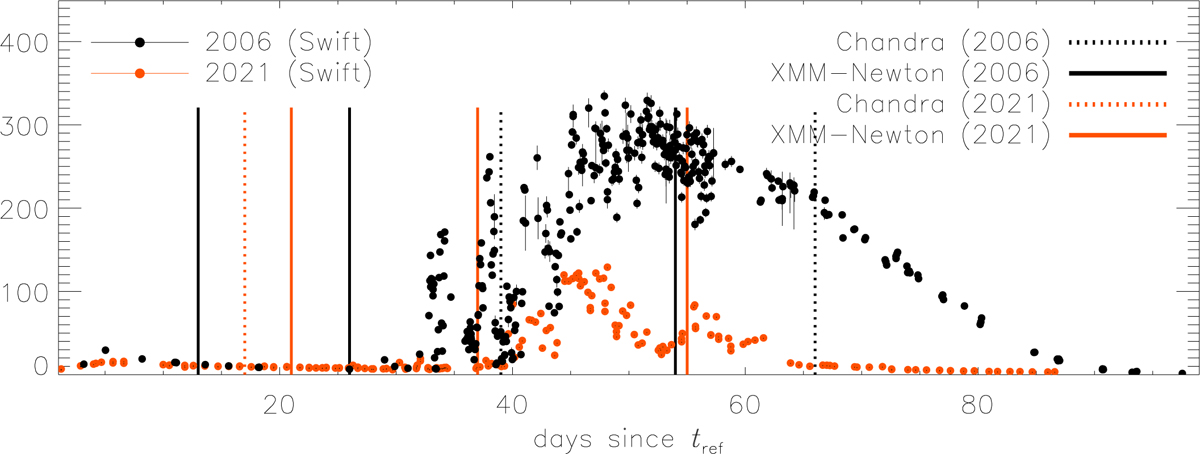
Comparison of long-term Swift X-ray light curves obtained during the 2006 (black) and 2021 (orange) outbursts (Page et al. 2022). The similar behaviour during the early shock phase until ~30 days after tref can be seen while the remarkable differences during the SSS- and decline phases after day ~30 are evident. Vertical lines mark the times of deeper Chandra (dotted) and XMM-Newton (solid) observations for the outbursts in 2006 (orange) and 2021 (black) as marked in the upper right legend. In this work, the two XMM-Newton observations taken on days 37.1 and 55.6 are discussed.
Current usage metrics show cumulative count of Article Views (full-text article views including HTML views, PDF and ePub downloads, according to the available data) and Abstracts Views on Vision4Press platform.
Data correspond to usage on the plateform after 2015. The current usage metrics is available 48-96 hours after online publication and is updated daily on week days.
Initial download of the metrics may take a while.