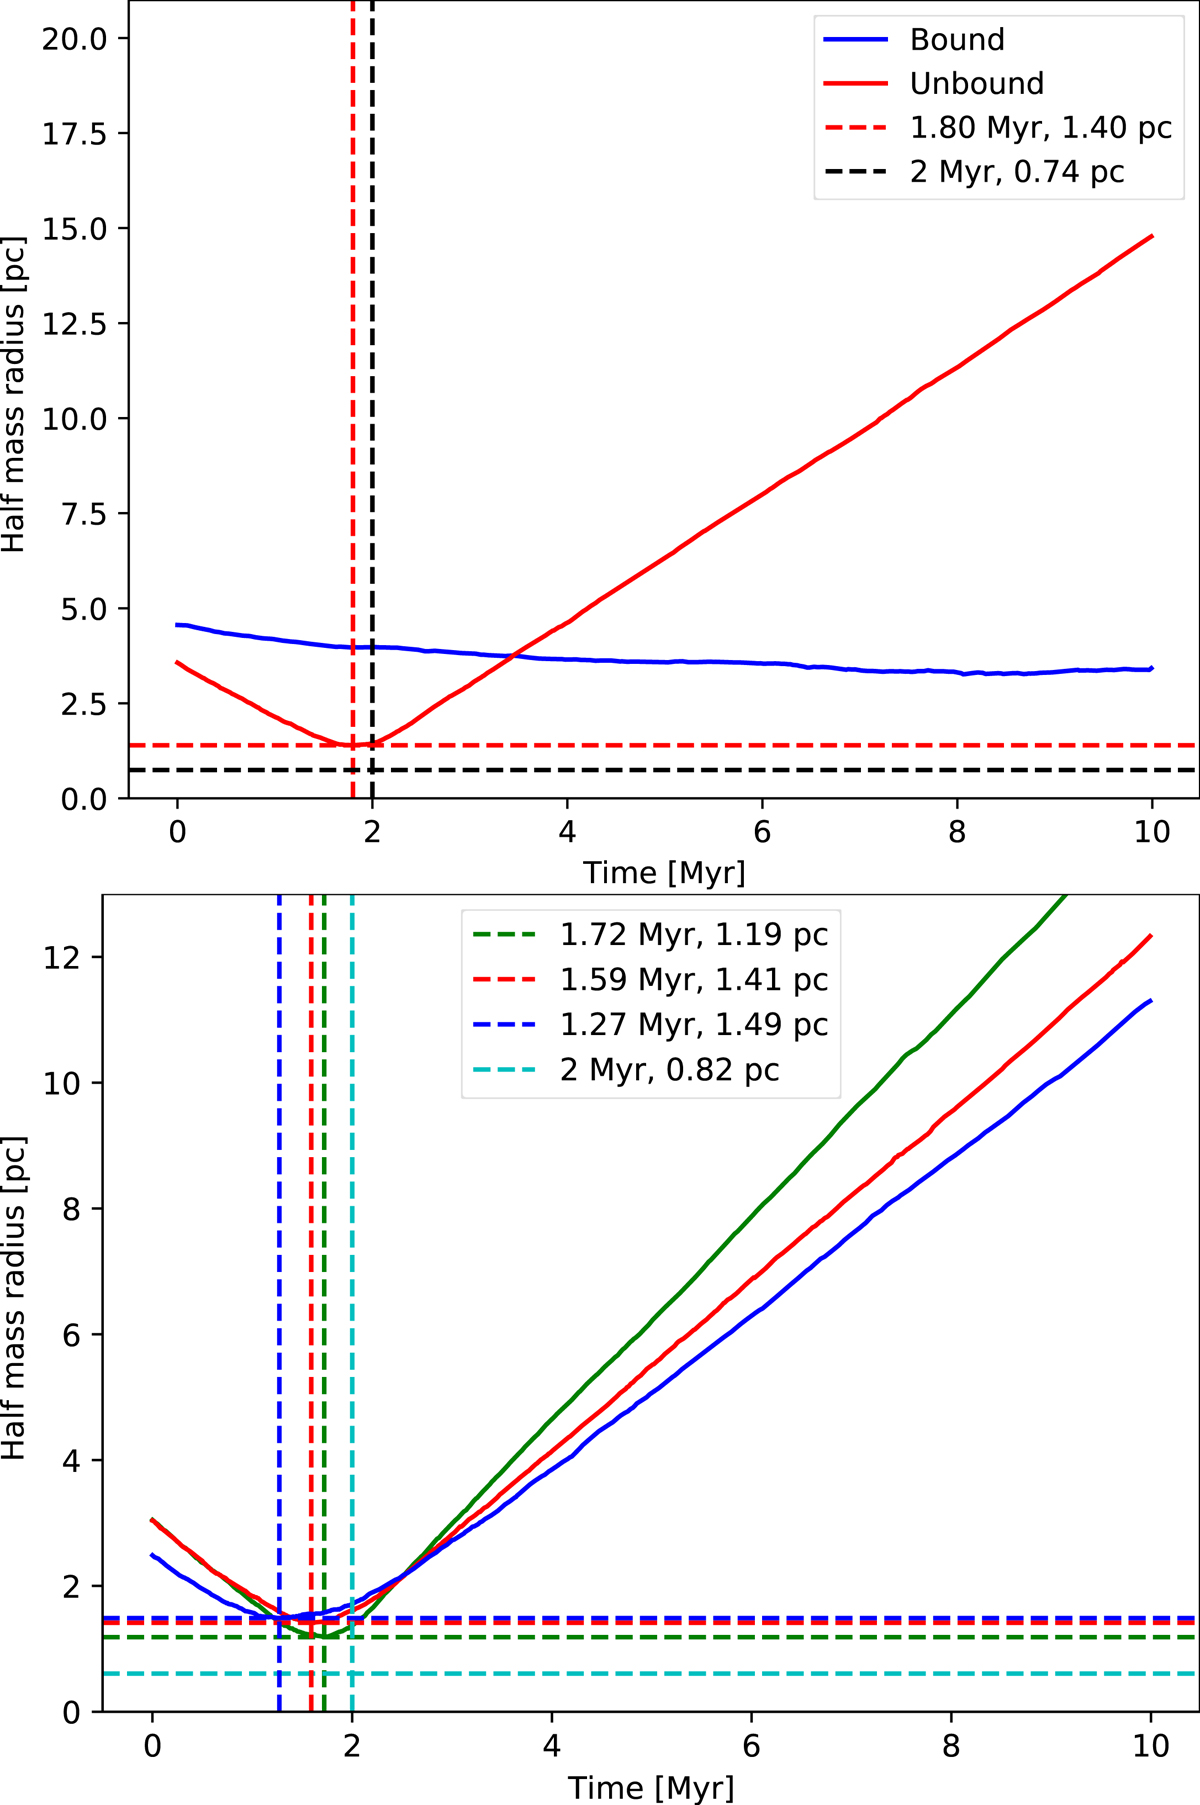
Fig. 6.
Download original image
Backtracked half-mass radii for a simulation with 1000 stars, Top: using bound (blue) and unbound (red) members only. Red dashed lines show temb and rhm at the time of gas expulsion determined using unbound stars whereas black dashed lines show the actual values of the same. Bottom: using unbound stars within 10 pc (blue), 20 pc (red) and 40 pc (green) from the cluster centre. The actual values of temb and rhm at the time of gas expulsion are shown in cyan.
Current usage metrics show cumulative count of Article Views (full-text article views including HTML views, PDF and ePub downloads, according to the available data) and Abstracts Views on Vision4Press platform.
Data correspond to usage on the plateform after 2015. The current usage metrics is available 48-96 hours after online publication and is updated daily on week days.
Initial download of the metrics may take a while.