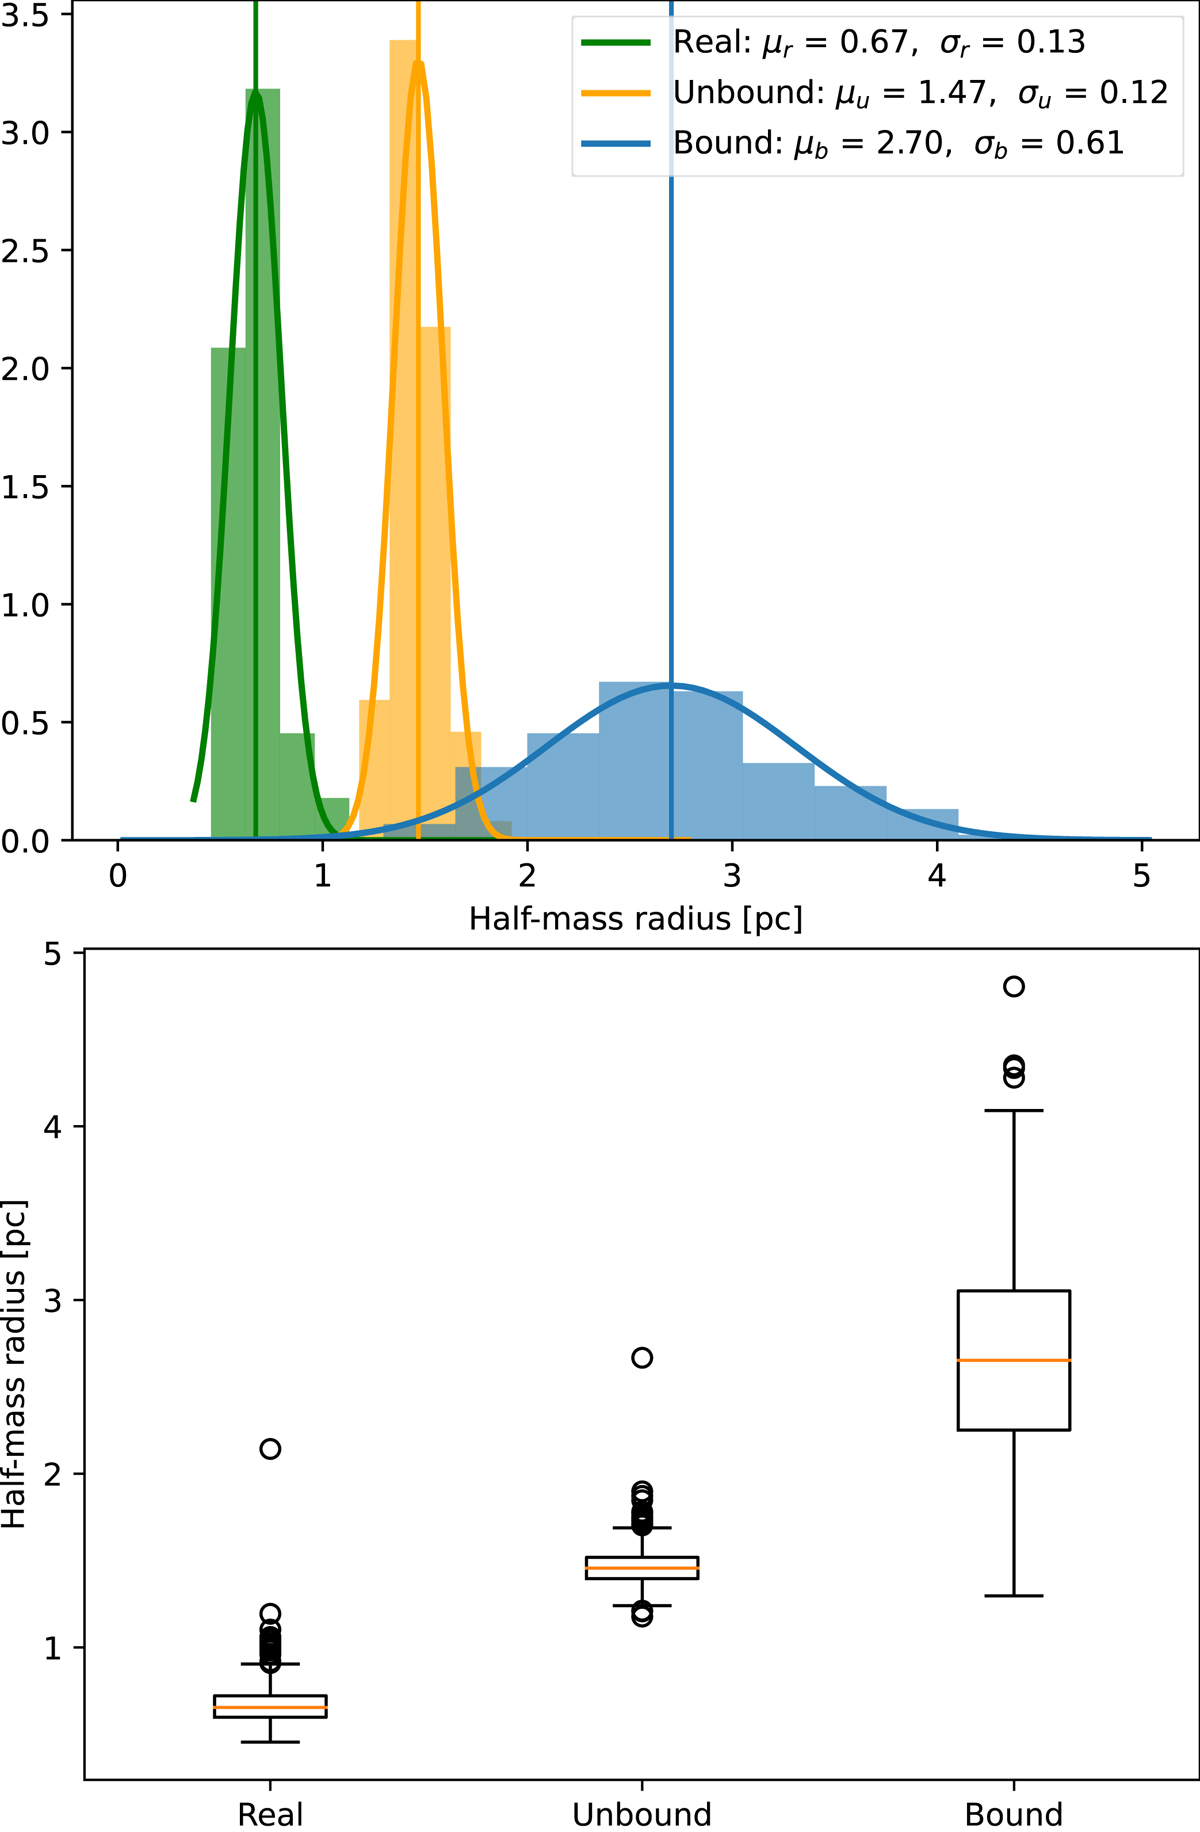
Fig. 4.
Download original image
Distributions of sizes derived using actual positions of all stars (Real, shown in green), using backtraced positions of unbound stars (Unbound, shown in orange), and using backtraced positions of bound stars (Bound, shown in blue) shown with histograms (top) and boxplots (bottom). The box extends from the lower to upper quartile values of the data, with a line at the median while the whiskers reach 1.5 times the interquartile range from the box.
Current usage metrics show cumulative count of Article Views (full-text article views including HTML views, PDF and ePub downloads, according to the available data) and Abstracts Views on Vision4Press platform.
Data correspond to usage on the plateform after 2015. The current usage metrics is available 48-96 hours after online publication and is updated daily on week days.
Initial download of the metrics may take a while.