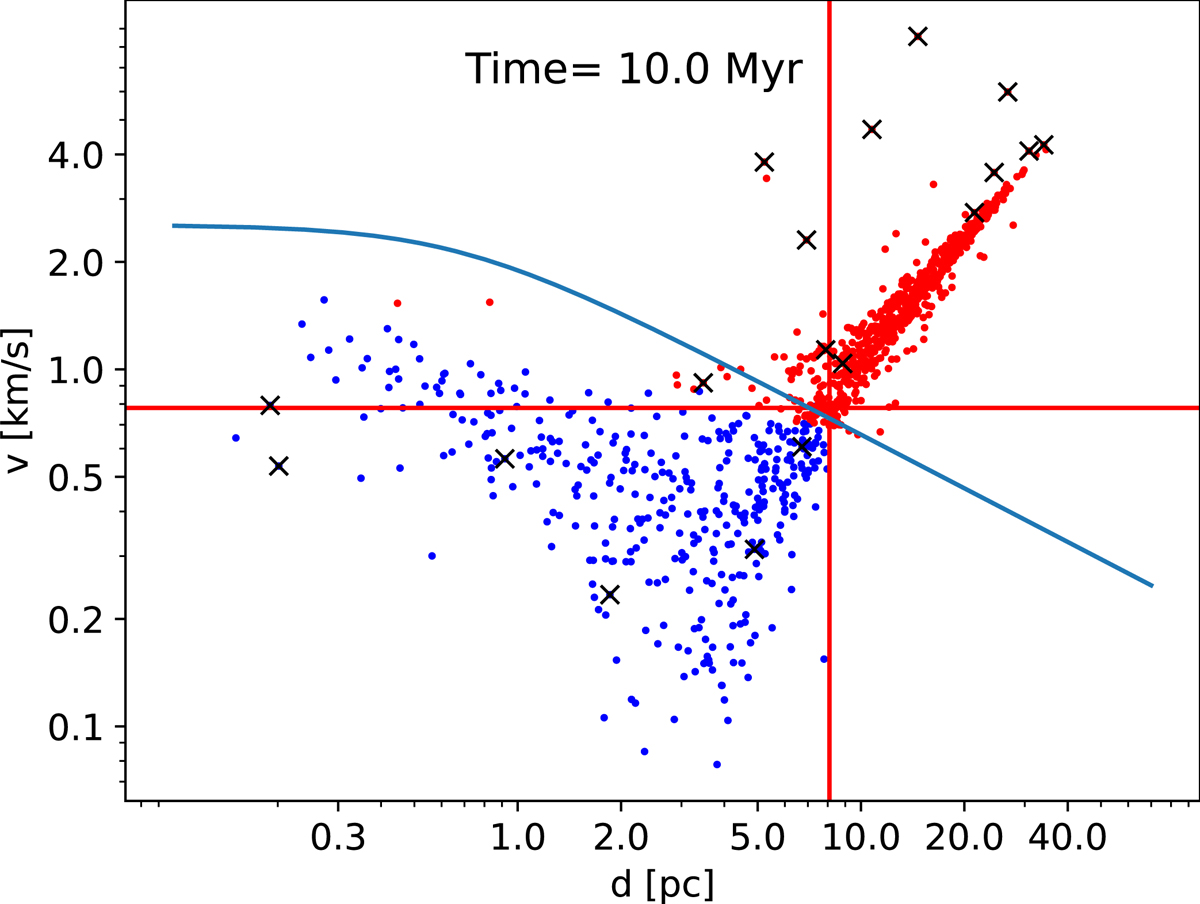
Fig. 3.
Download original image
Phase space diagram for an N = 1000 star cluster simulation at t = 10 Myr. The bound and unbound members are shown in blue and red colours respectively. Vertical and horizontal red lines indicate distance and velocity cutoffs respectively for unbound stars. The light blue line represents the analytical escape velocity dependence on distance from the cluster centre derived assuming a Plummer distribution for the members. The black crosses show the stars that underwent a strong encounter.
Current usage metrics show cumulative count of Article Views (full-text article views including HTML views, PDF and ePub downloads, according to the available data) and Abstracts Views on Vision4Press platform.
Data correspond to usage on the plateform after 2015. The current usage metrics is available 48-96 hours after online publication and is updated daily on week days.
Initial download of the metrics may take a while.