Fig. 2.
Download original image
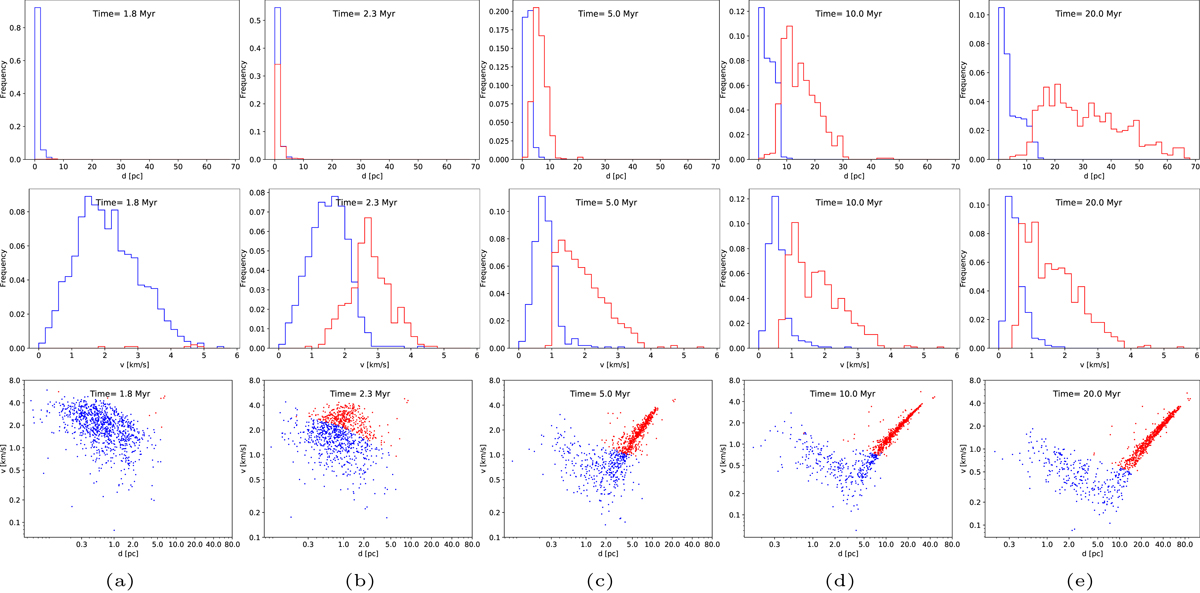
Snapshot of distance (top) and velocity distribution (middle), and distance vs. velocity scatter plot (bottom) (a) before gas expulsion (t = 1.8 Myr), (b) just after gas expulsion (t = 2.3 Myr), (c) at t = 5 Myr, (d) at t = 10 Myr, and (e) at the end of our simulation (t = 20 Myr). All plots show the bound stars in blue and the unbound stars in red. A simulation of N = 1000 stars is used here.
Current usage metrics show cumulative count of Article Views (full-text article views including HTML views, PDF and ePub downloads, according to the available data) and Abstracts Views on Vision4Press platform.
Data correspond to usage on the plateform after 2015. The current usage metrics is available 48-96 hours after online publication and is updated daily on week days.
Initial download of the metrics may take a while.