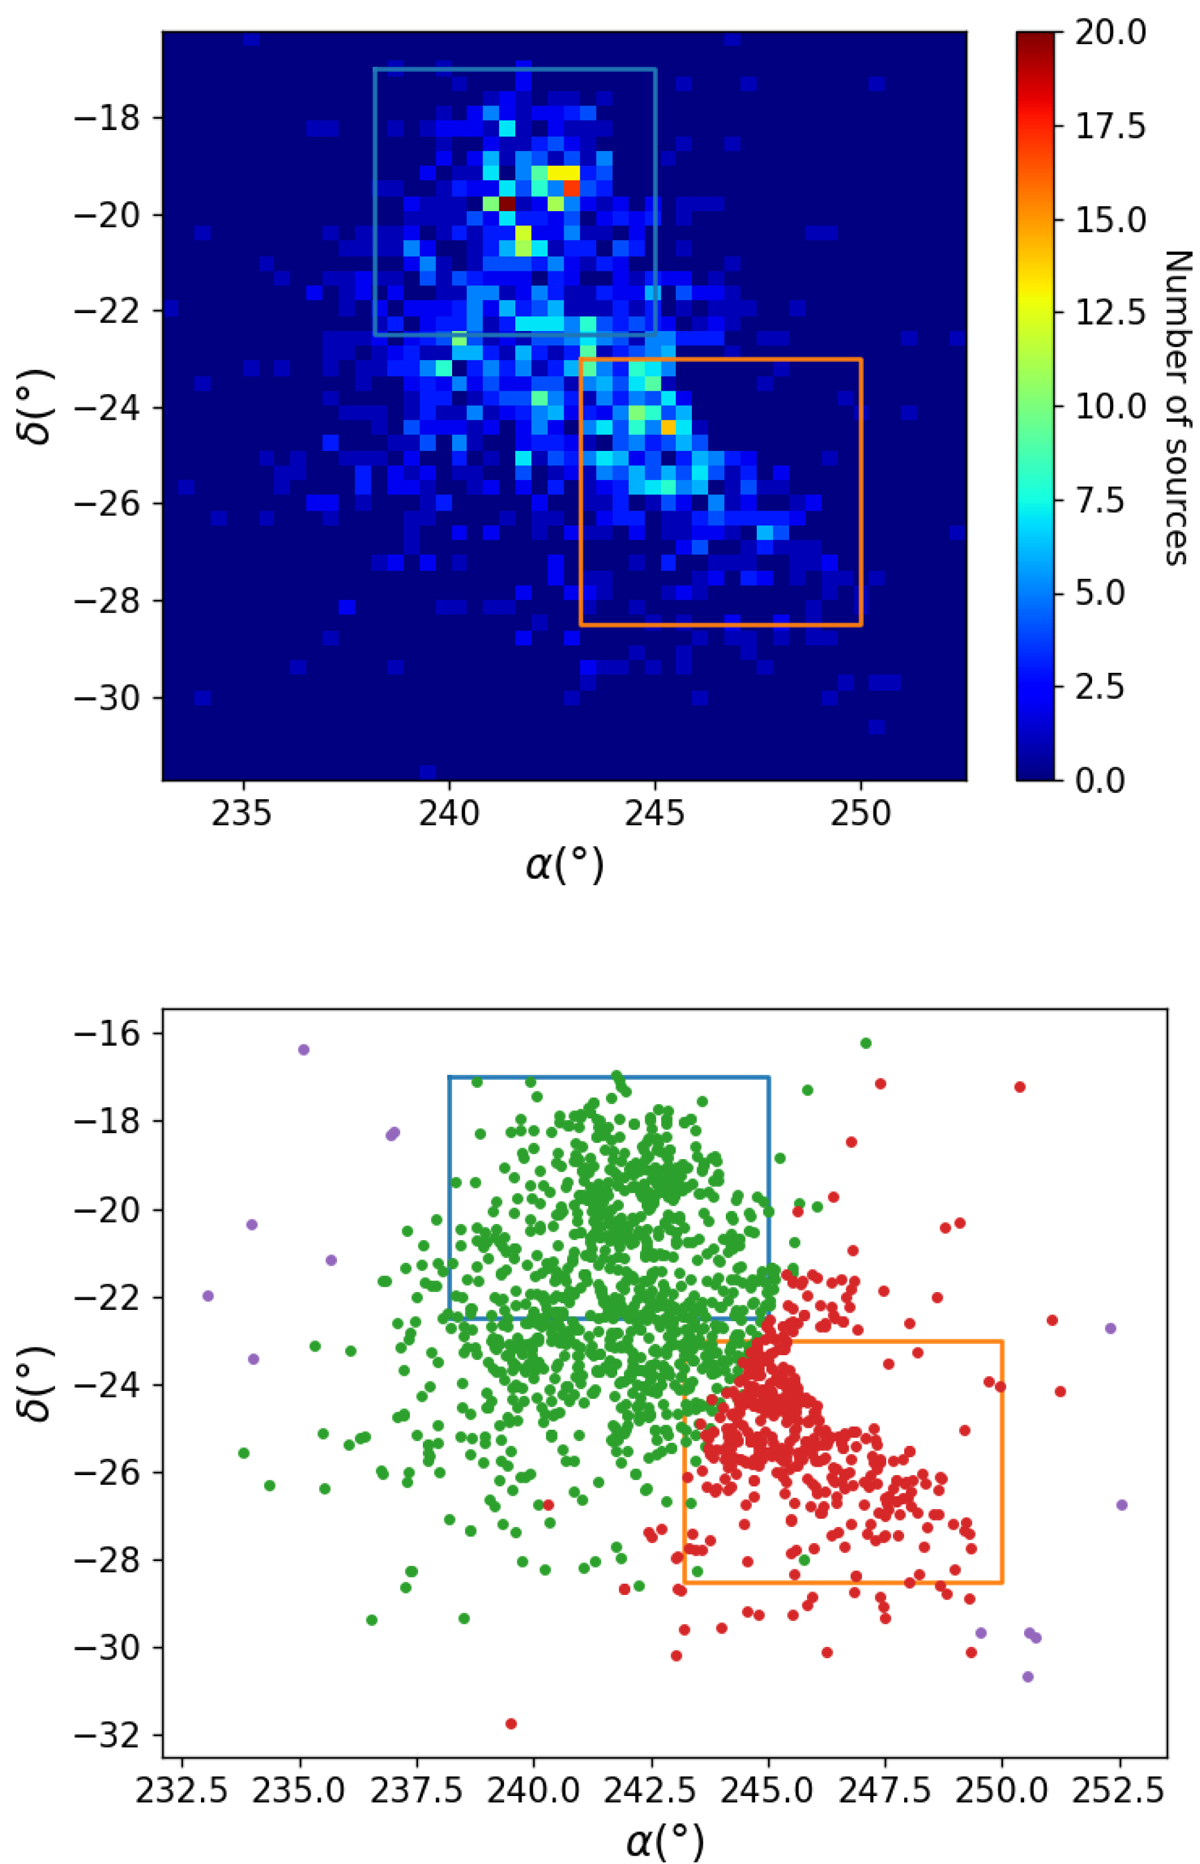
Fig. C.1.
Download original image
Density distribution (top) and scatter plot (bottom) of the Upper Sco members at the present time. The two rectangles show the area selected for the clustering process. Green and red points in the bottom plot show the members of Group 1 and Group 2, respectively. Purple points are the ones which were not assigned to any group.
Current usage metrics show cumulative count of Article Views (full-text article views including HTML views, PDF and ePub downloads, according to the available data) and Abstracts Views on Vision4Press platform.
Data correspond to usage on the plateform after 2015. The current usage metrics is available 48-96 hours after online publication and is updated daily on week days.
Initial download of the metrics may take a while.