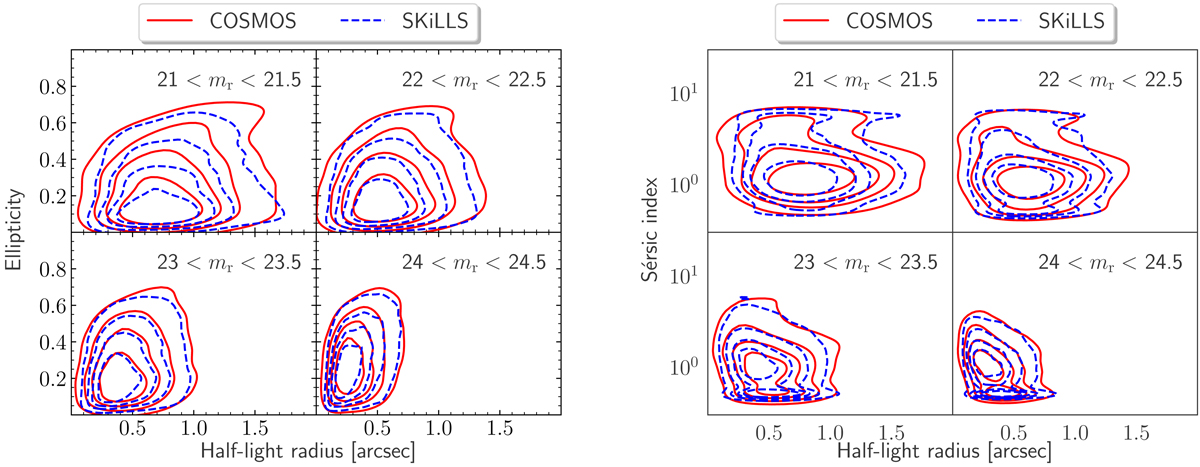
Fig. 4.
Download original image
Two-dimensional kernel density plots of morphological parameters in several magnitude bins. The red solid and blue dashed lines denote the training and target samples, respectively. Left panel: the correlation between the size and ellipticity, whilst the right panel presents the correlation between the size and Sérsic index. The plotted contour levels are 20%, 40%, 60%, 80%.
Current usage metrics show cumulative count of Article Views (full-text article views including HTML views, PDF and ePub downloads, according to the available data) and Abstracts Views on Vision4Press platform.
Data correspond to usage on the plateform after 2015. The current usage metrics is available 48-96 hours after online publication and is updated daily on week days.
Initial download of the metrics may take a while.