Fig. E.1.
Download original image
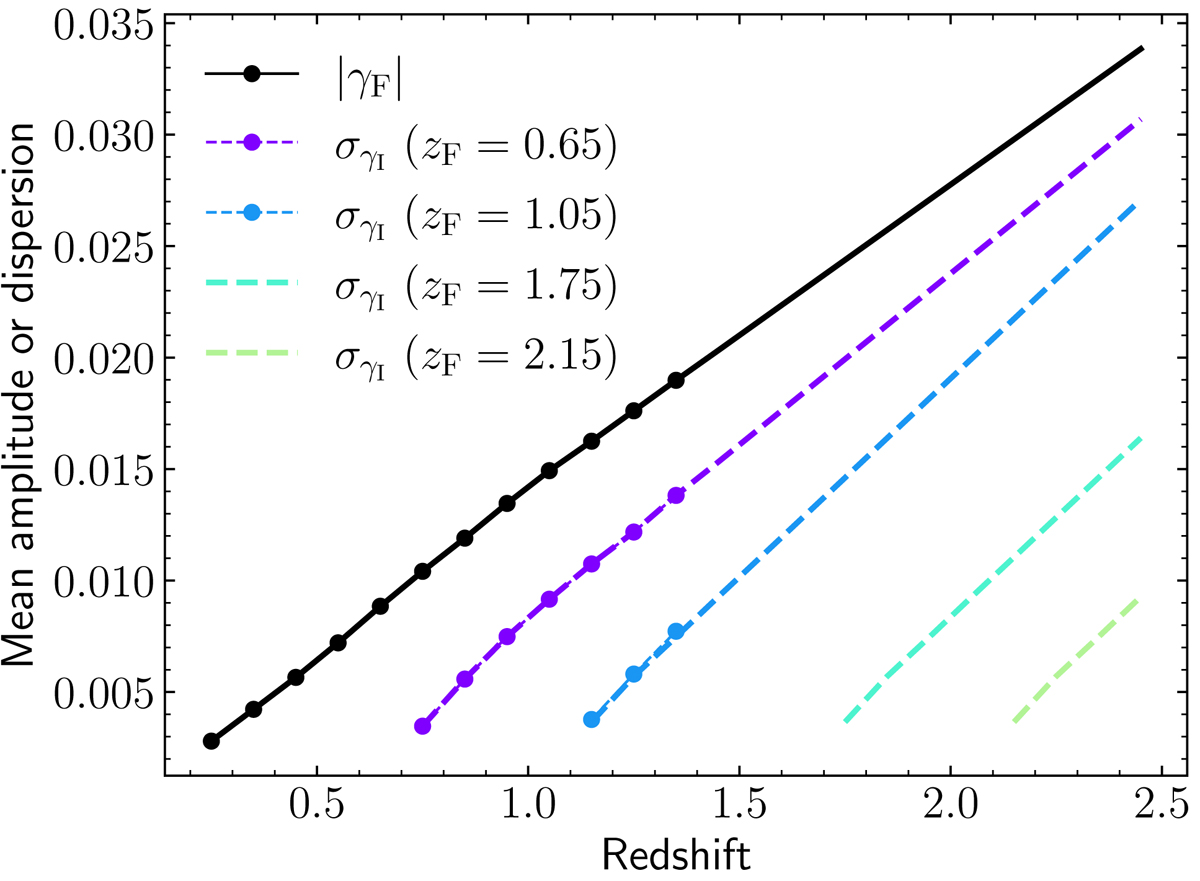
Cosmic shear signals learned from the MICECAT2 (Eq. E.1). The black solid line and points indicate the mean amplitude of the γF component, whilst the coloured lines and points show the γI dispersion for several redshifts of the foreground galaxies. The points are direct measurements from the MICECAT2, while the lines are linear extrapolations.
Current usage metrics show cumulative count of Article Views (full-text article views including HTML views, PDF and ePub downloads, according to the available data) and Abstracts Views on Vision4Press platform.
Data correspond to usage on the plateform after 2015. The current usage metrics is available 48-96 hours after online publication and is updated daily on week days.
Initial download of the metrics may take a while.